AC200 (non-P) on (standby), AC DC both off. 12 hour mark. Down from 100% to 97%.
Test Start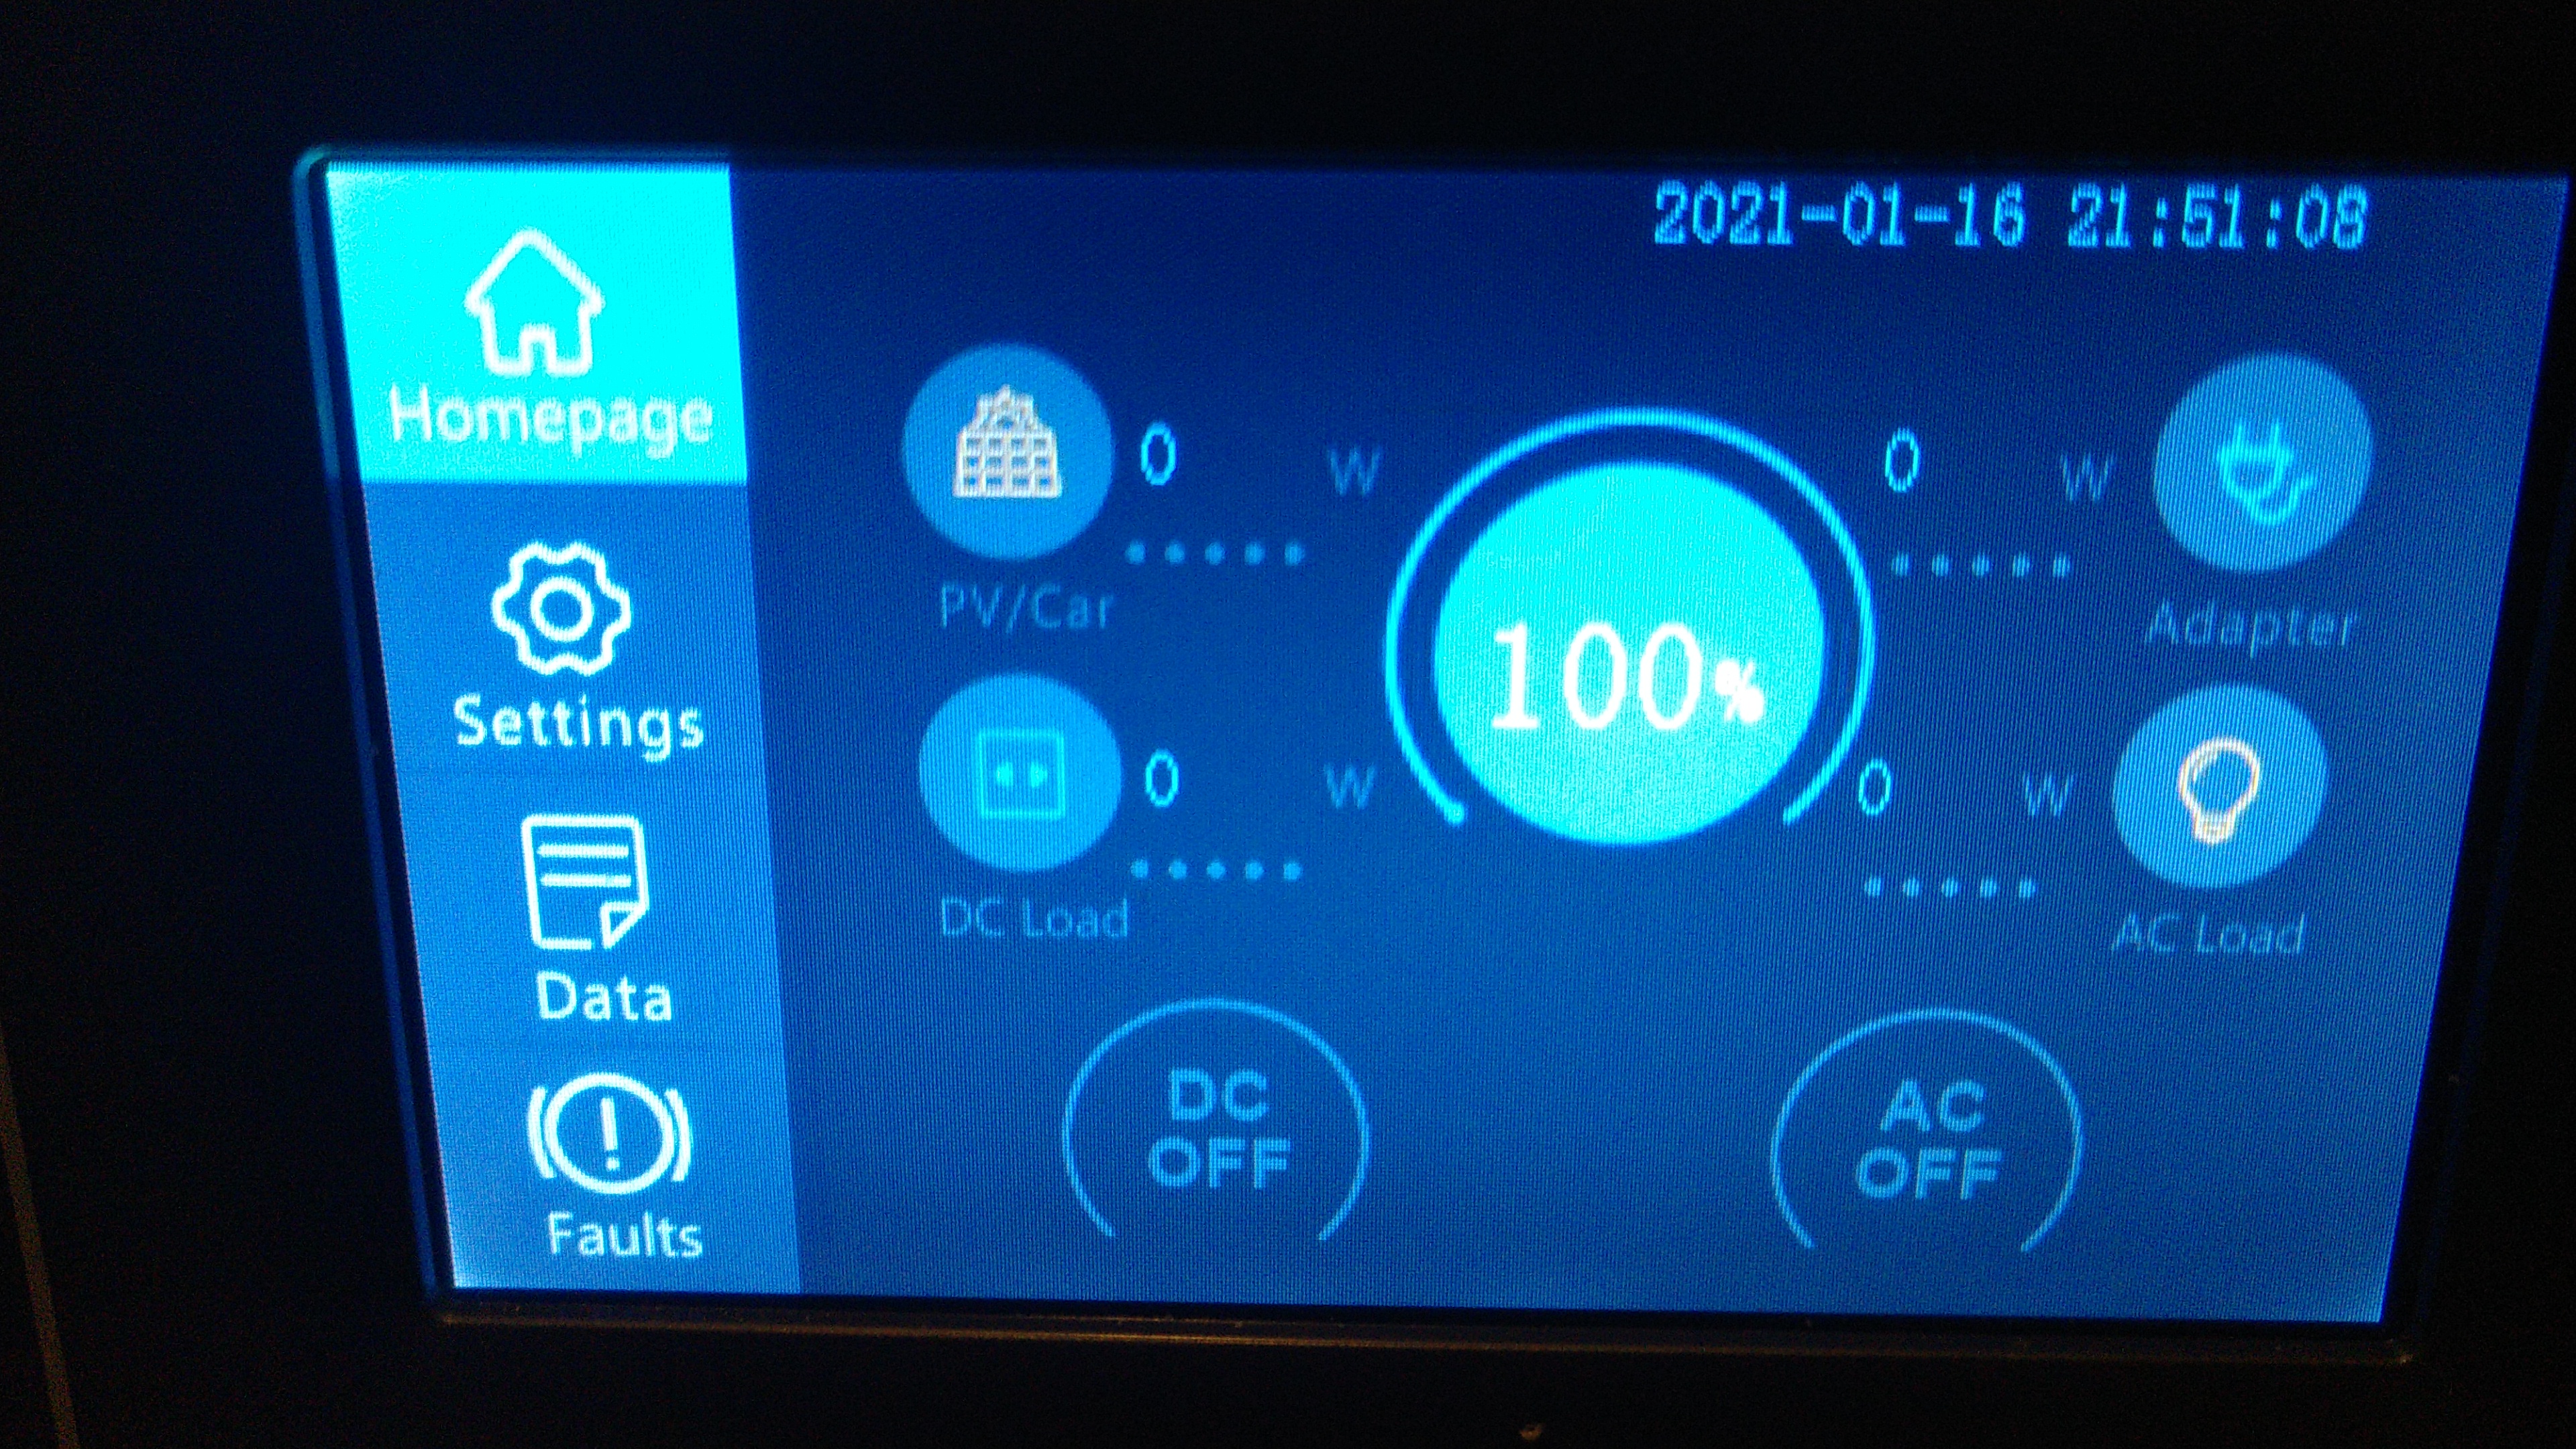
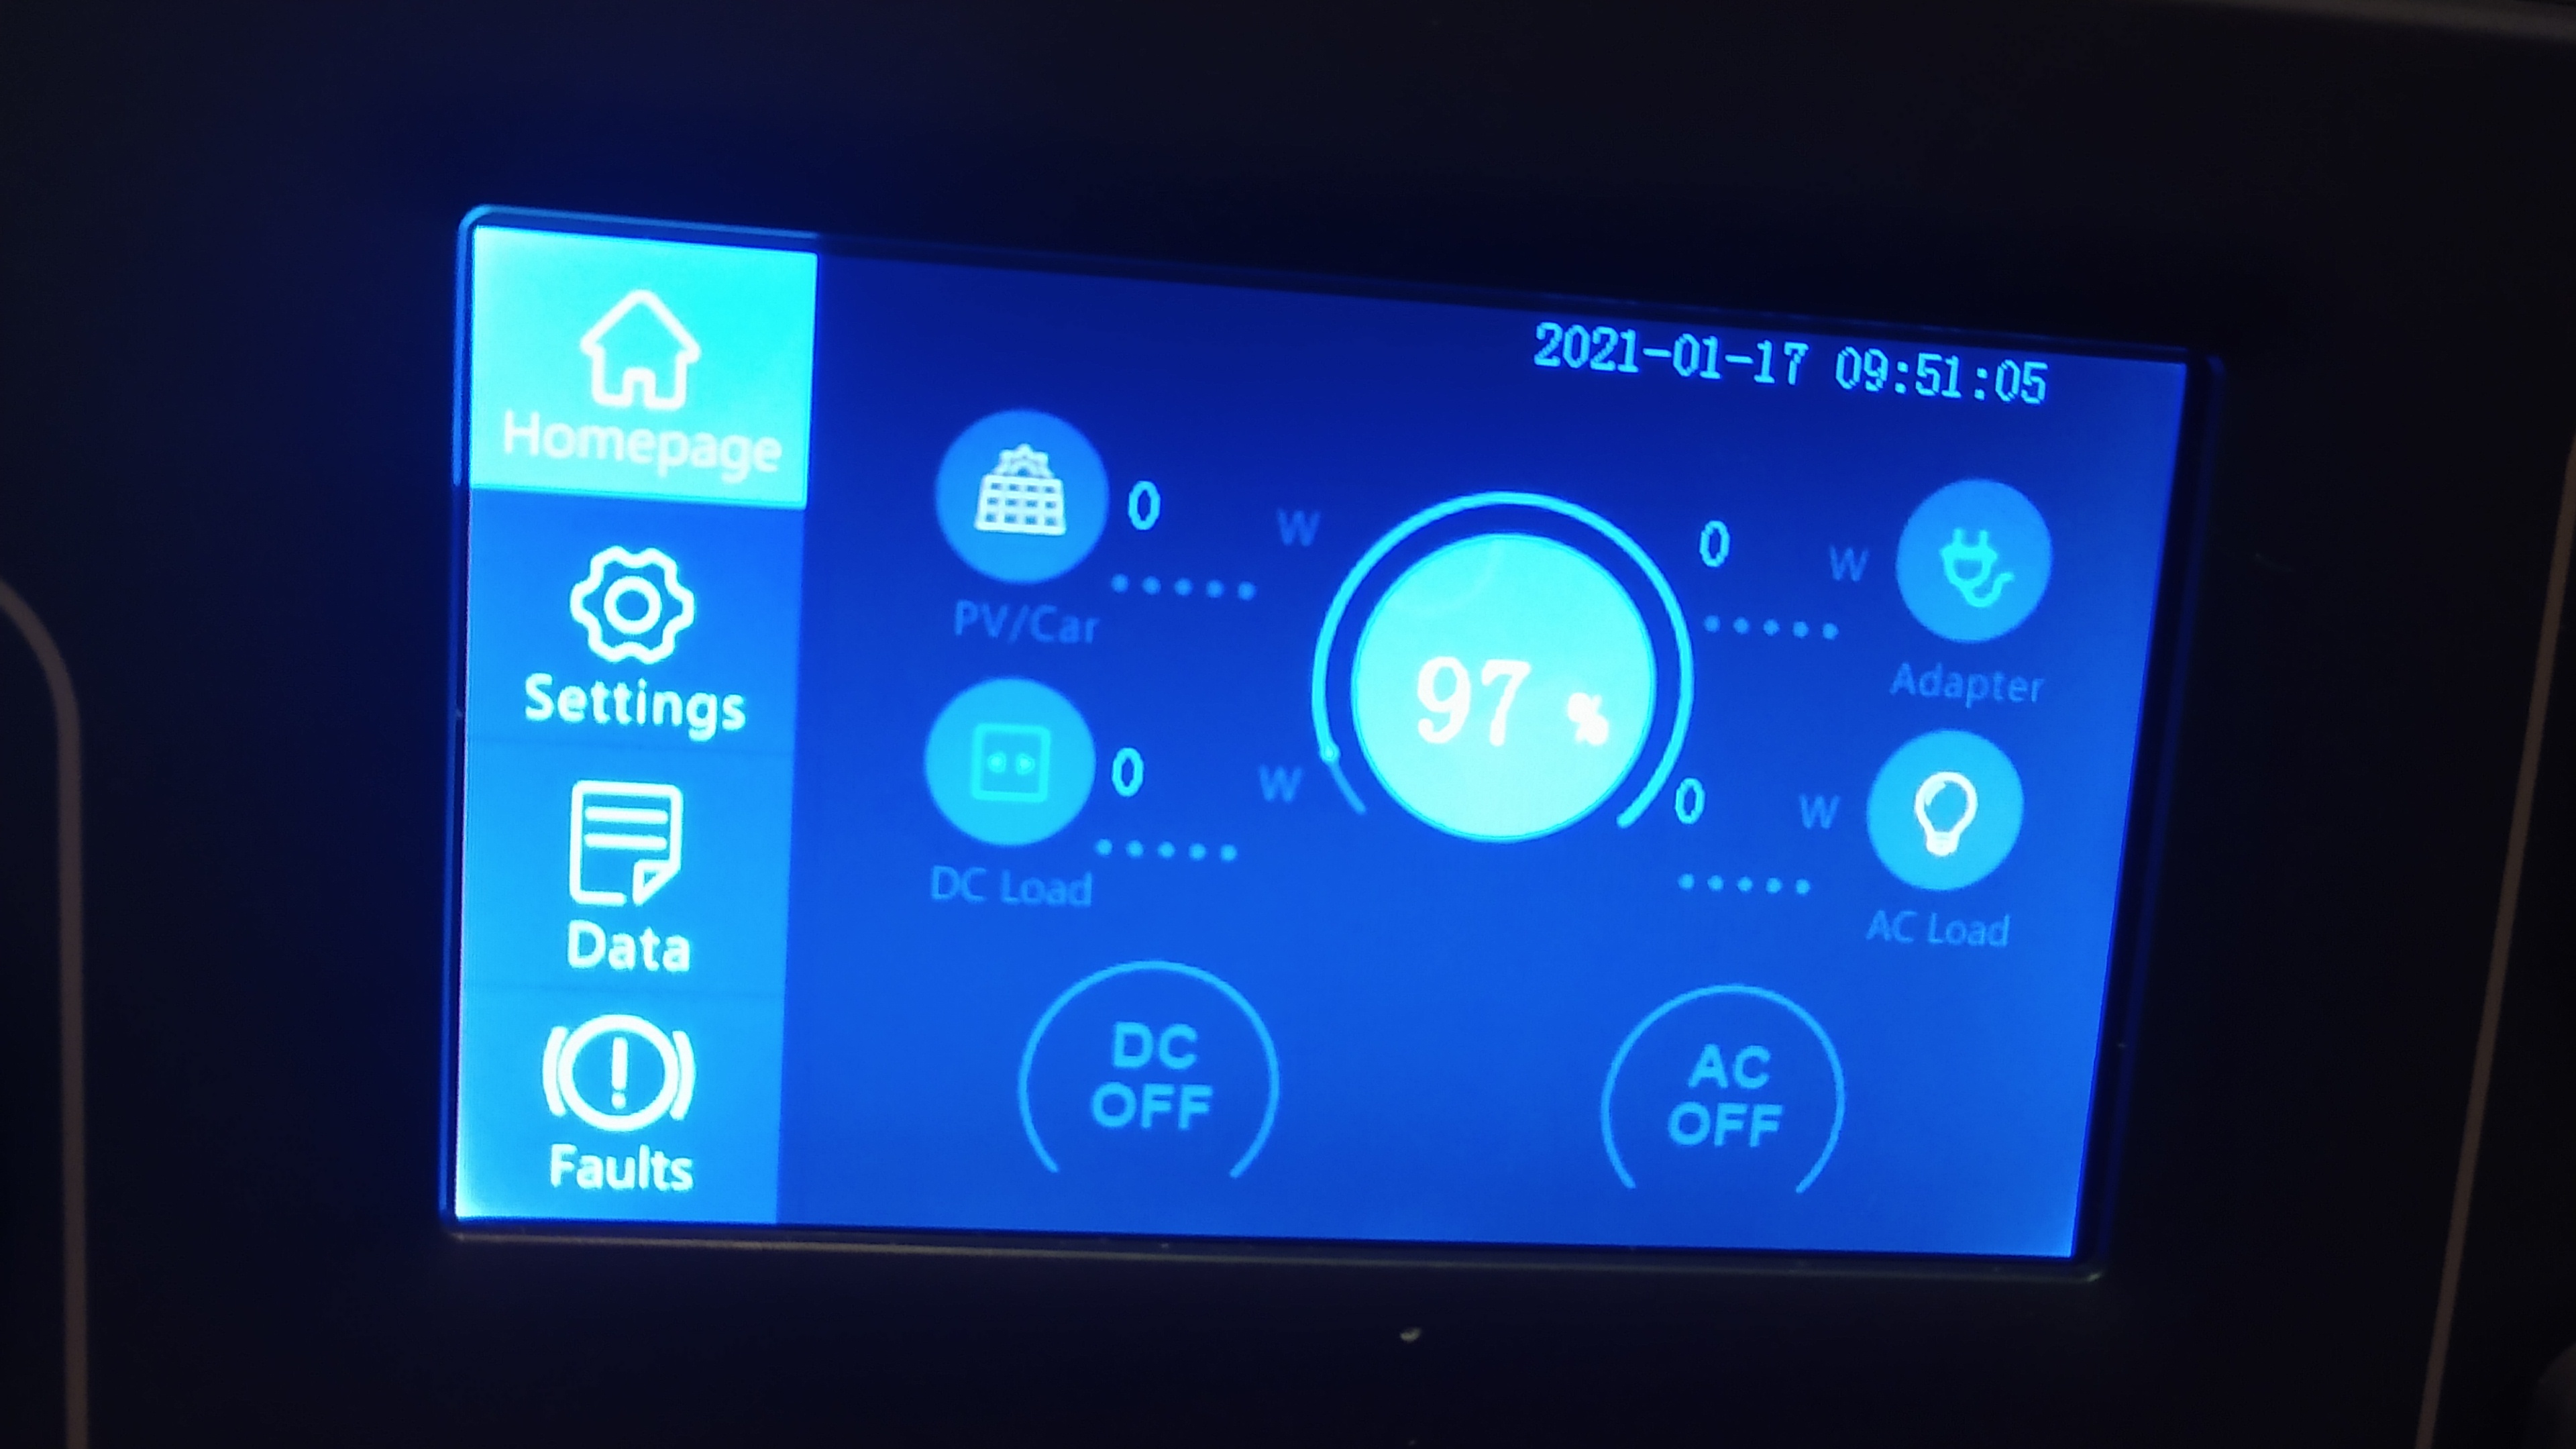
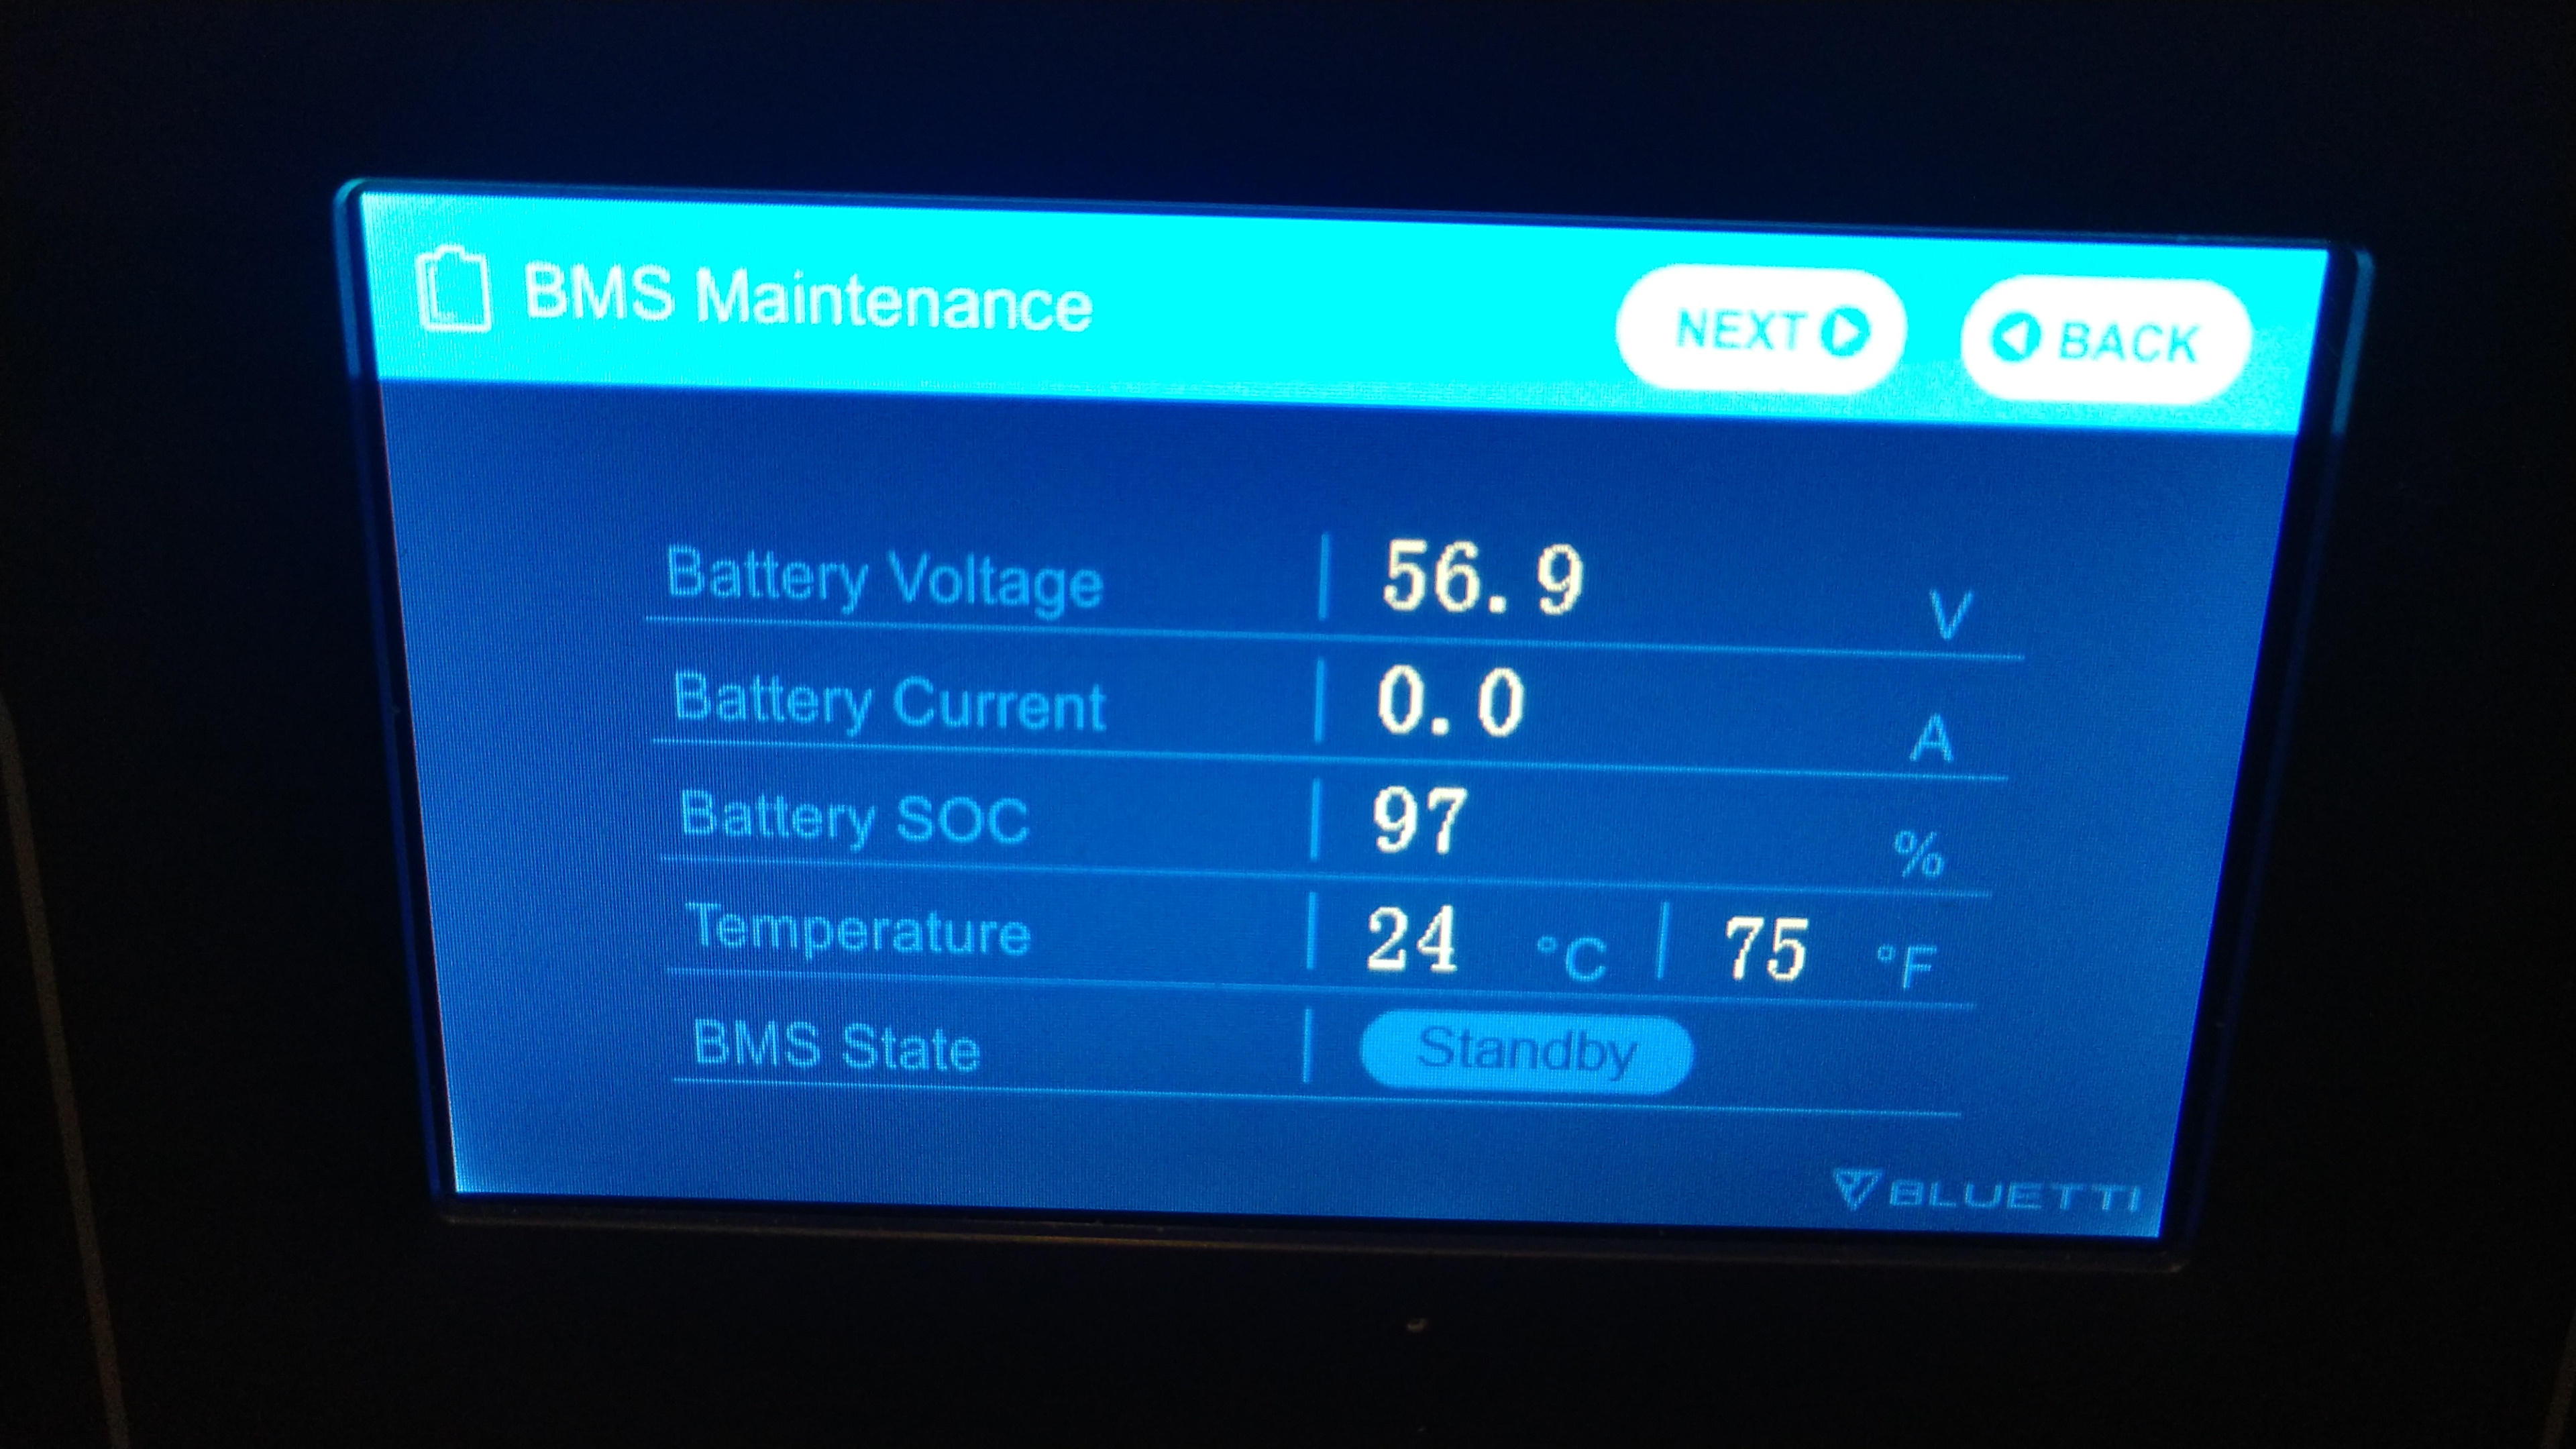
12 hour reading, 97%
AC200 (non-P) on (standby), AC DC both off. 12 hour mark. Down from 100% to 97%.
Test StartThanks mark.
Something definitely seems wrong with the 200p
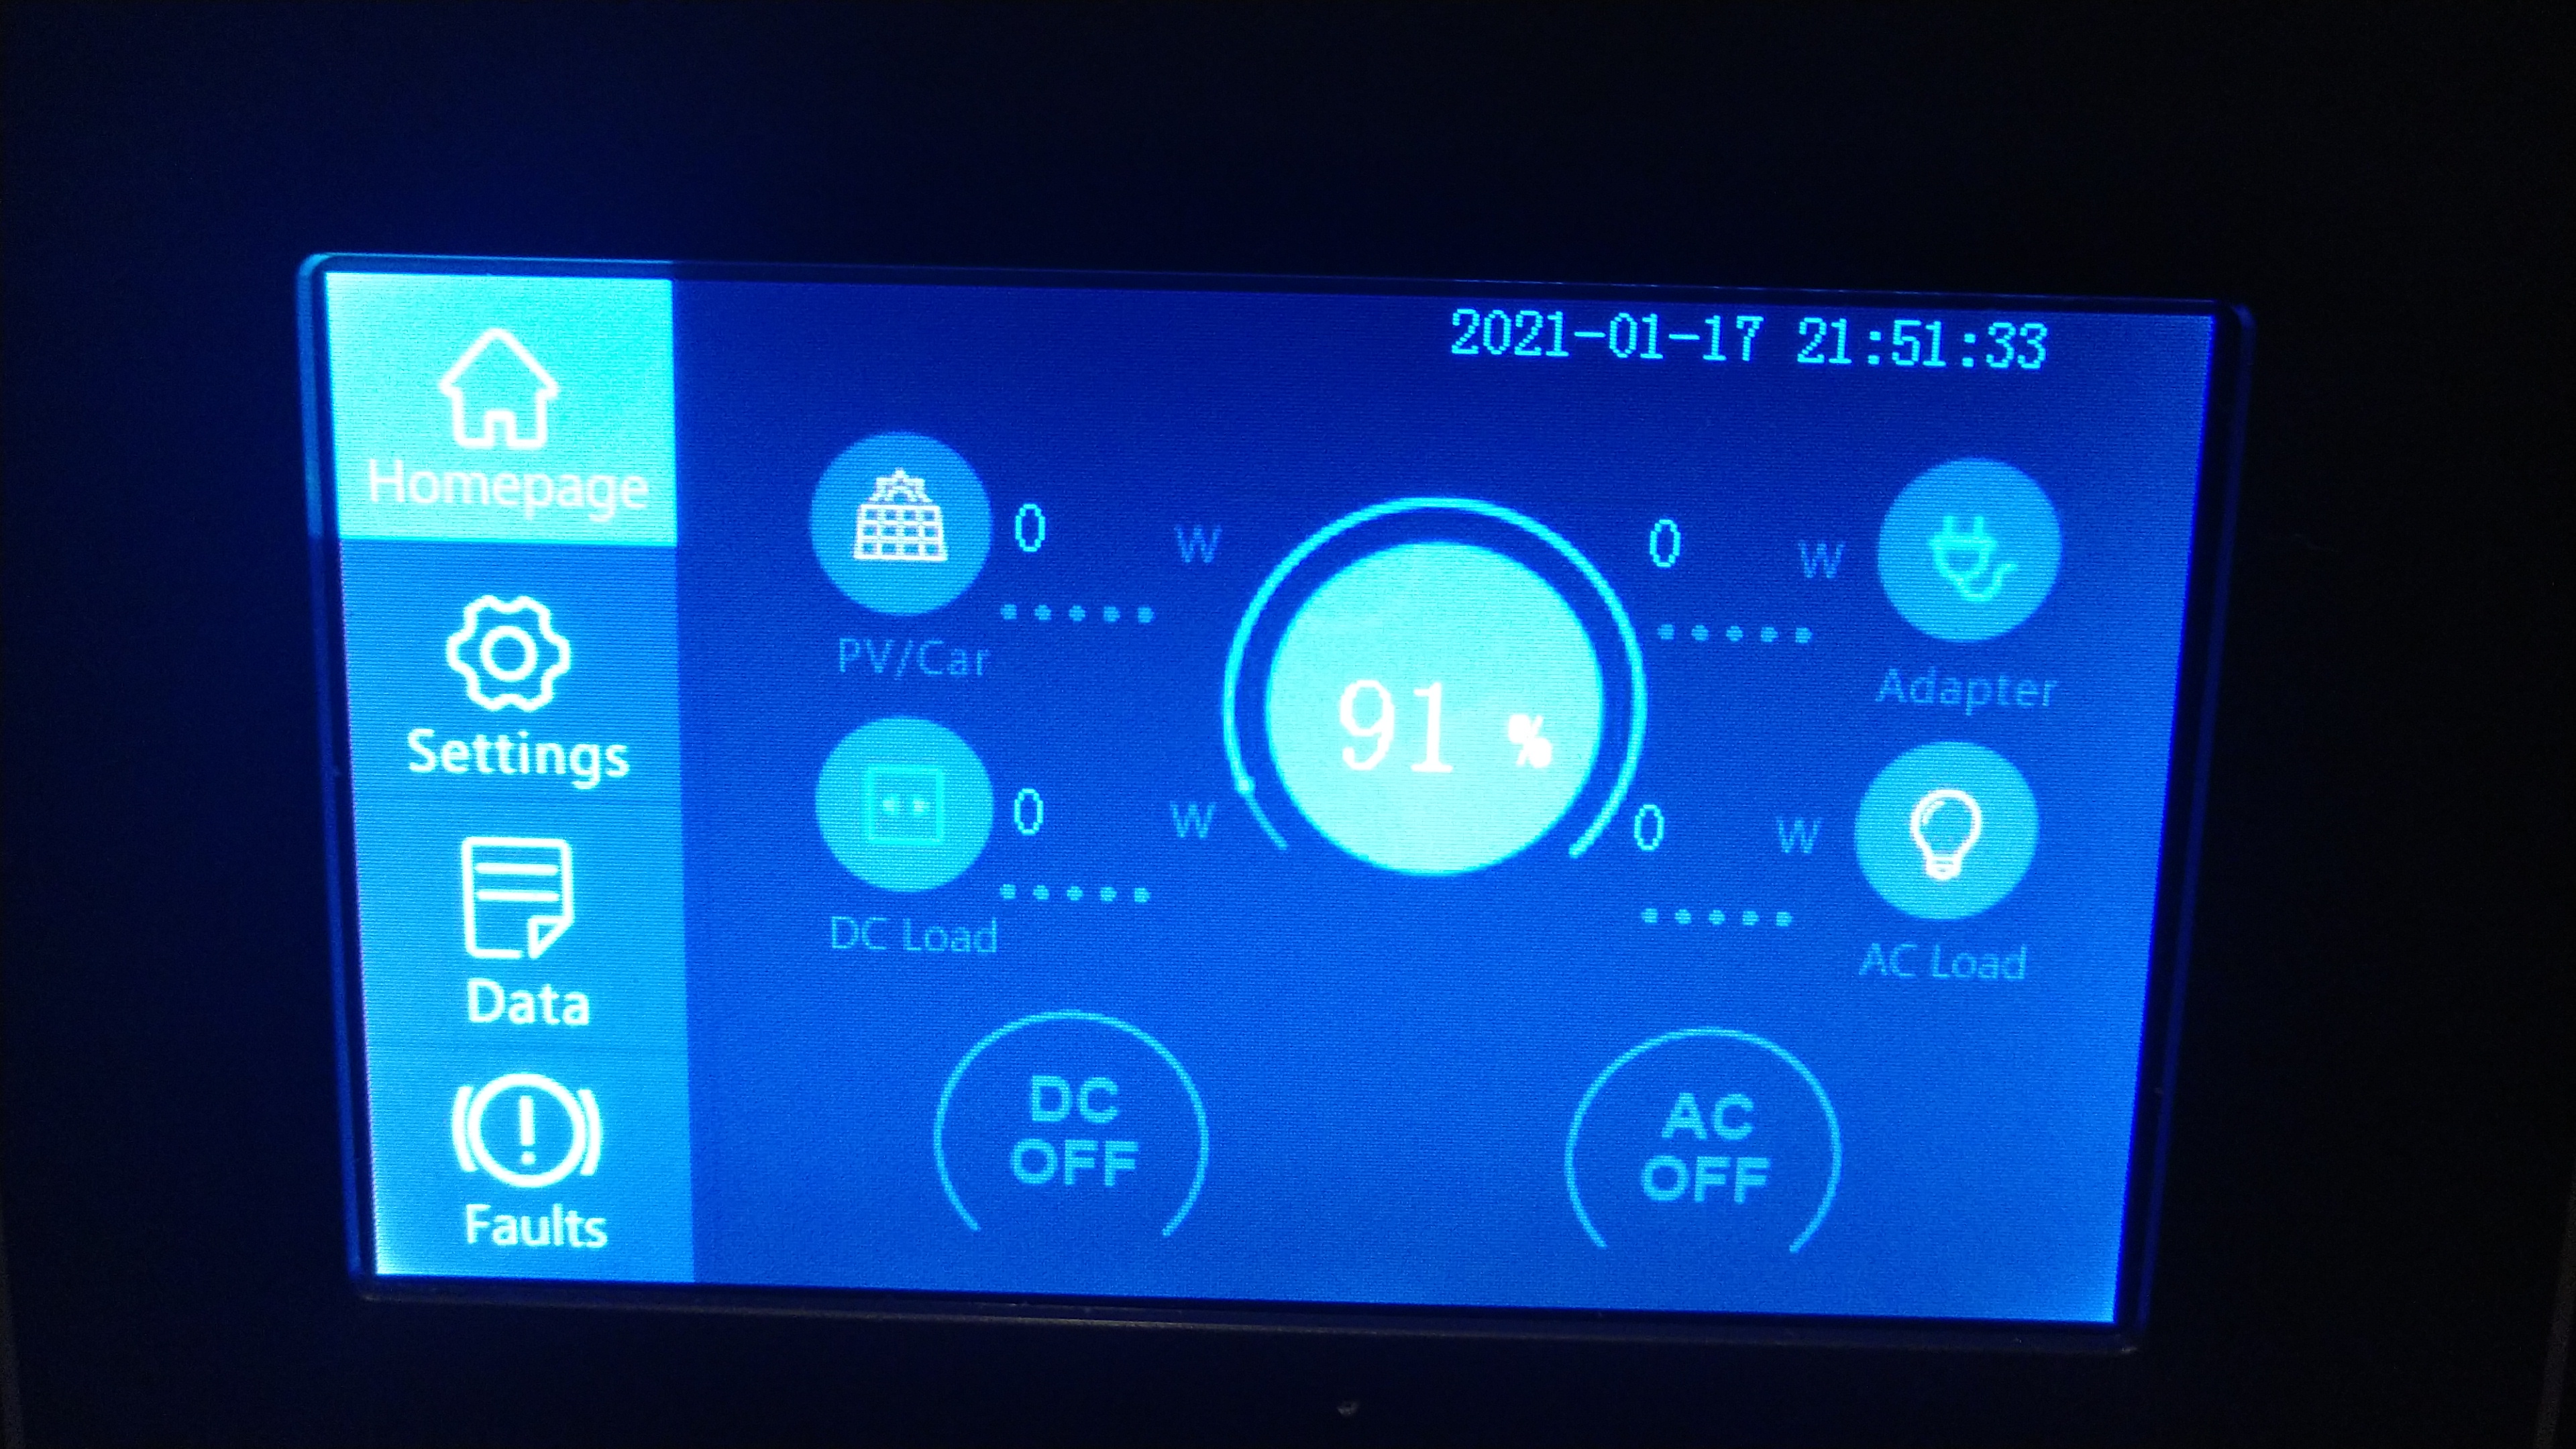
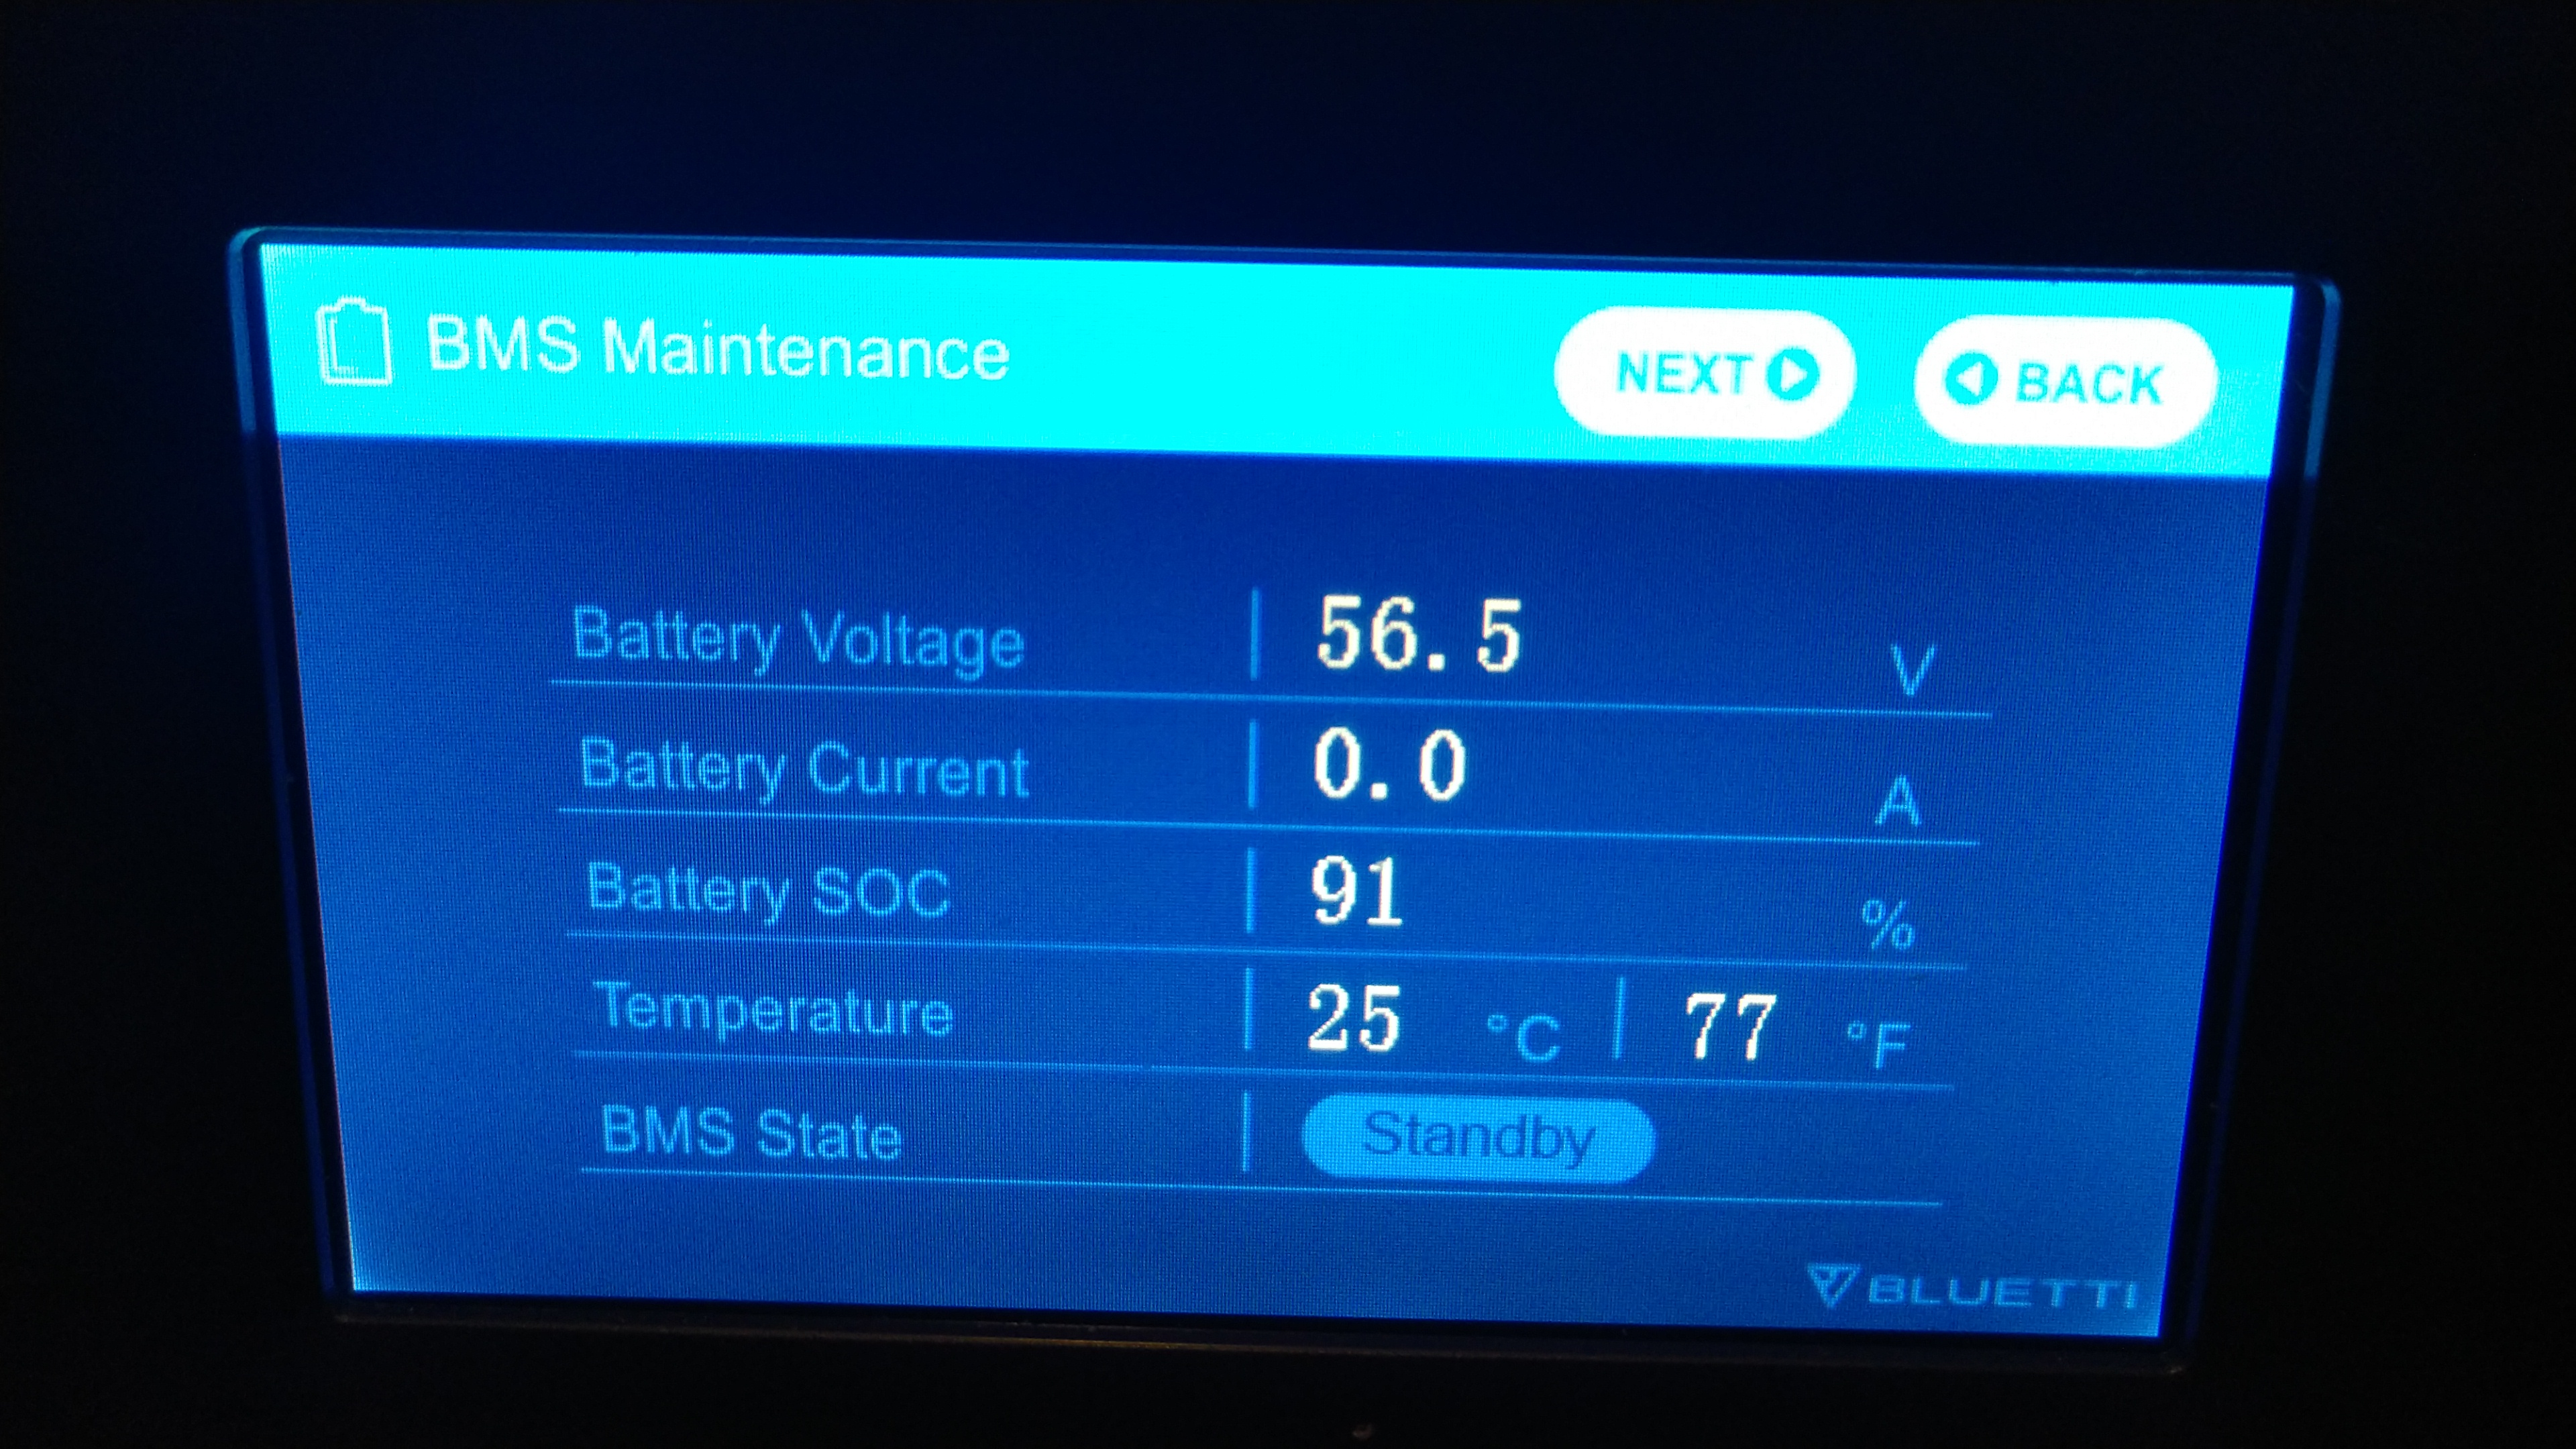
At the 24 hour mark, 91%. That’s kind of interesting. The first 12 hours took it from 100% to 97%, or 3%. But the second 12 hours took it from 97% to 91%, or 6%…double the drain of the first 12 hours. Perhaps the first 12 hours was burning through some extra surface charge or something?
That’s pretty normal for all lithium battery devices. The same case with my iPhone, the 100% to 99% is super long lasting, maybe last for 30mins, but drops quite fast after 99%.
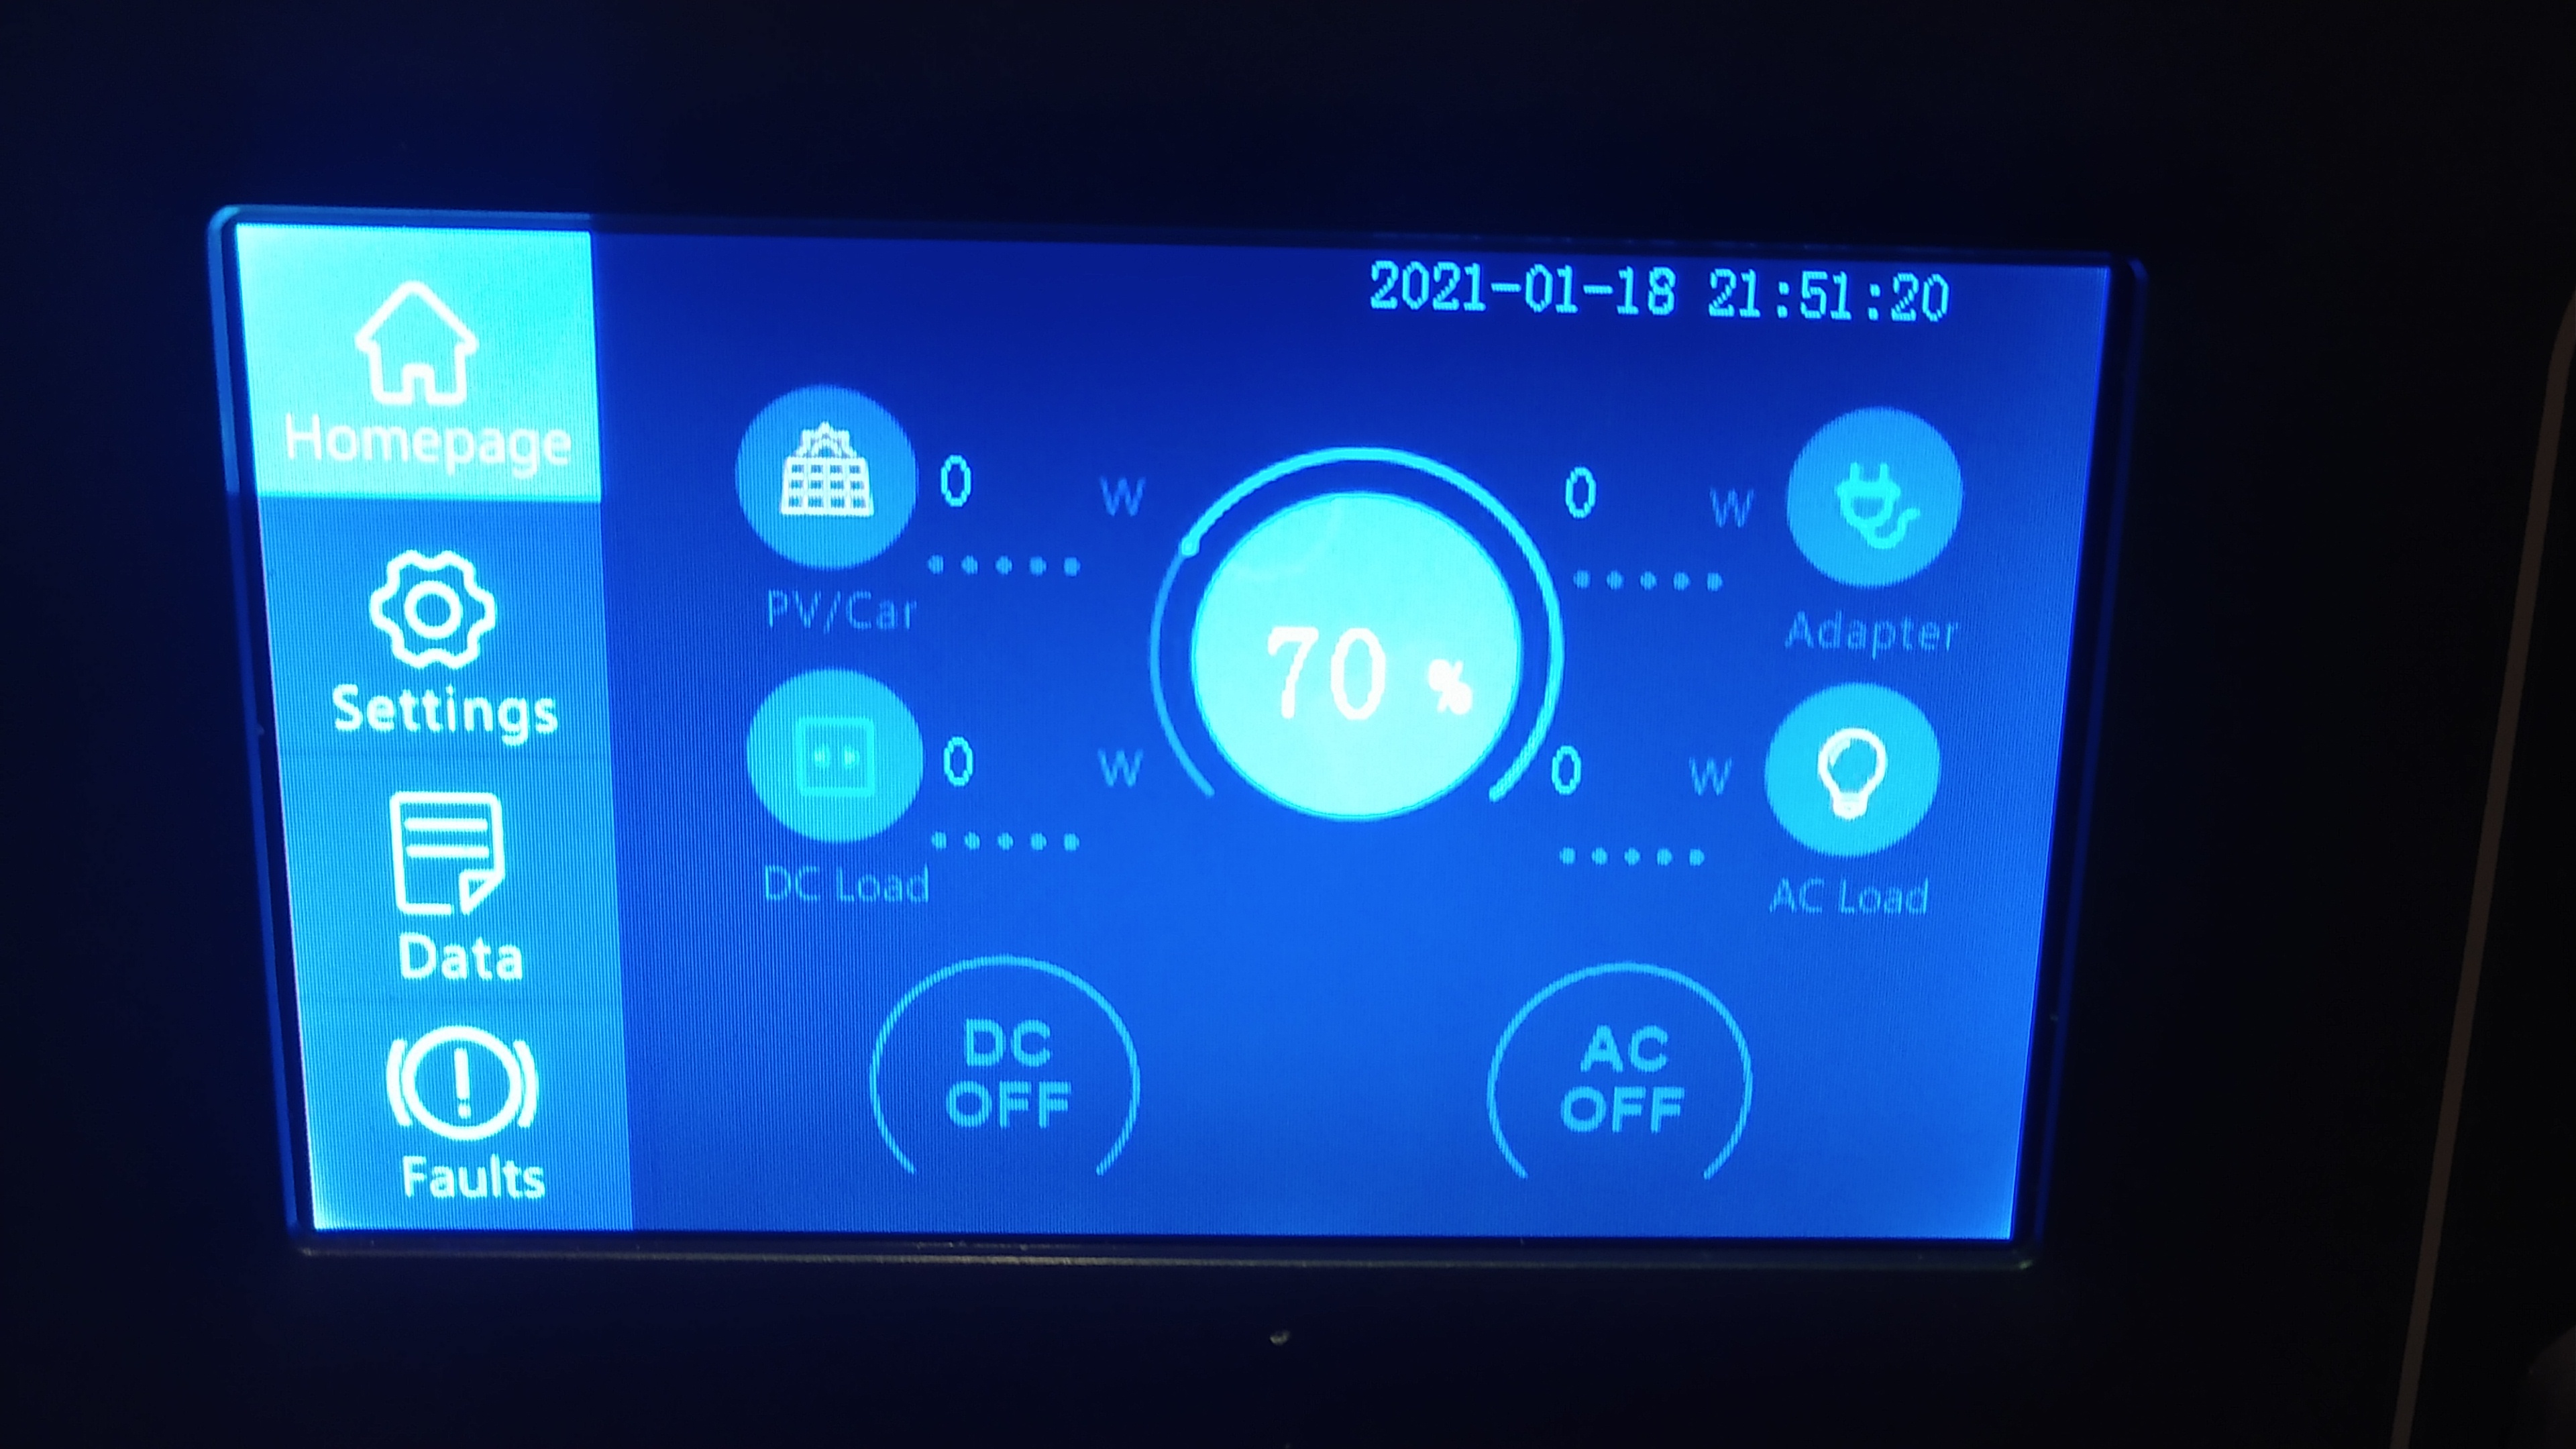
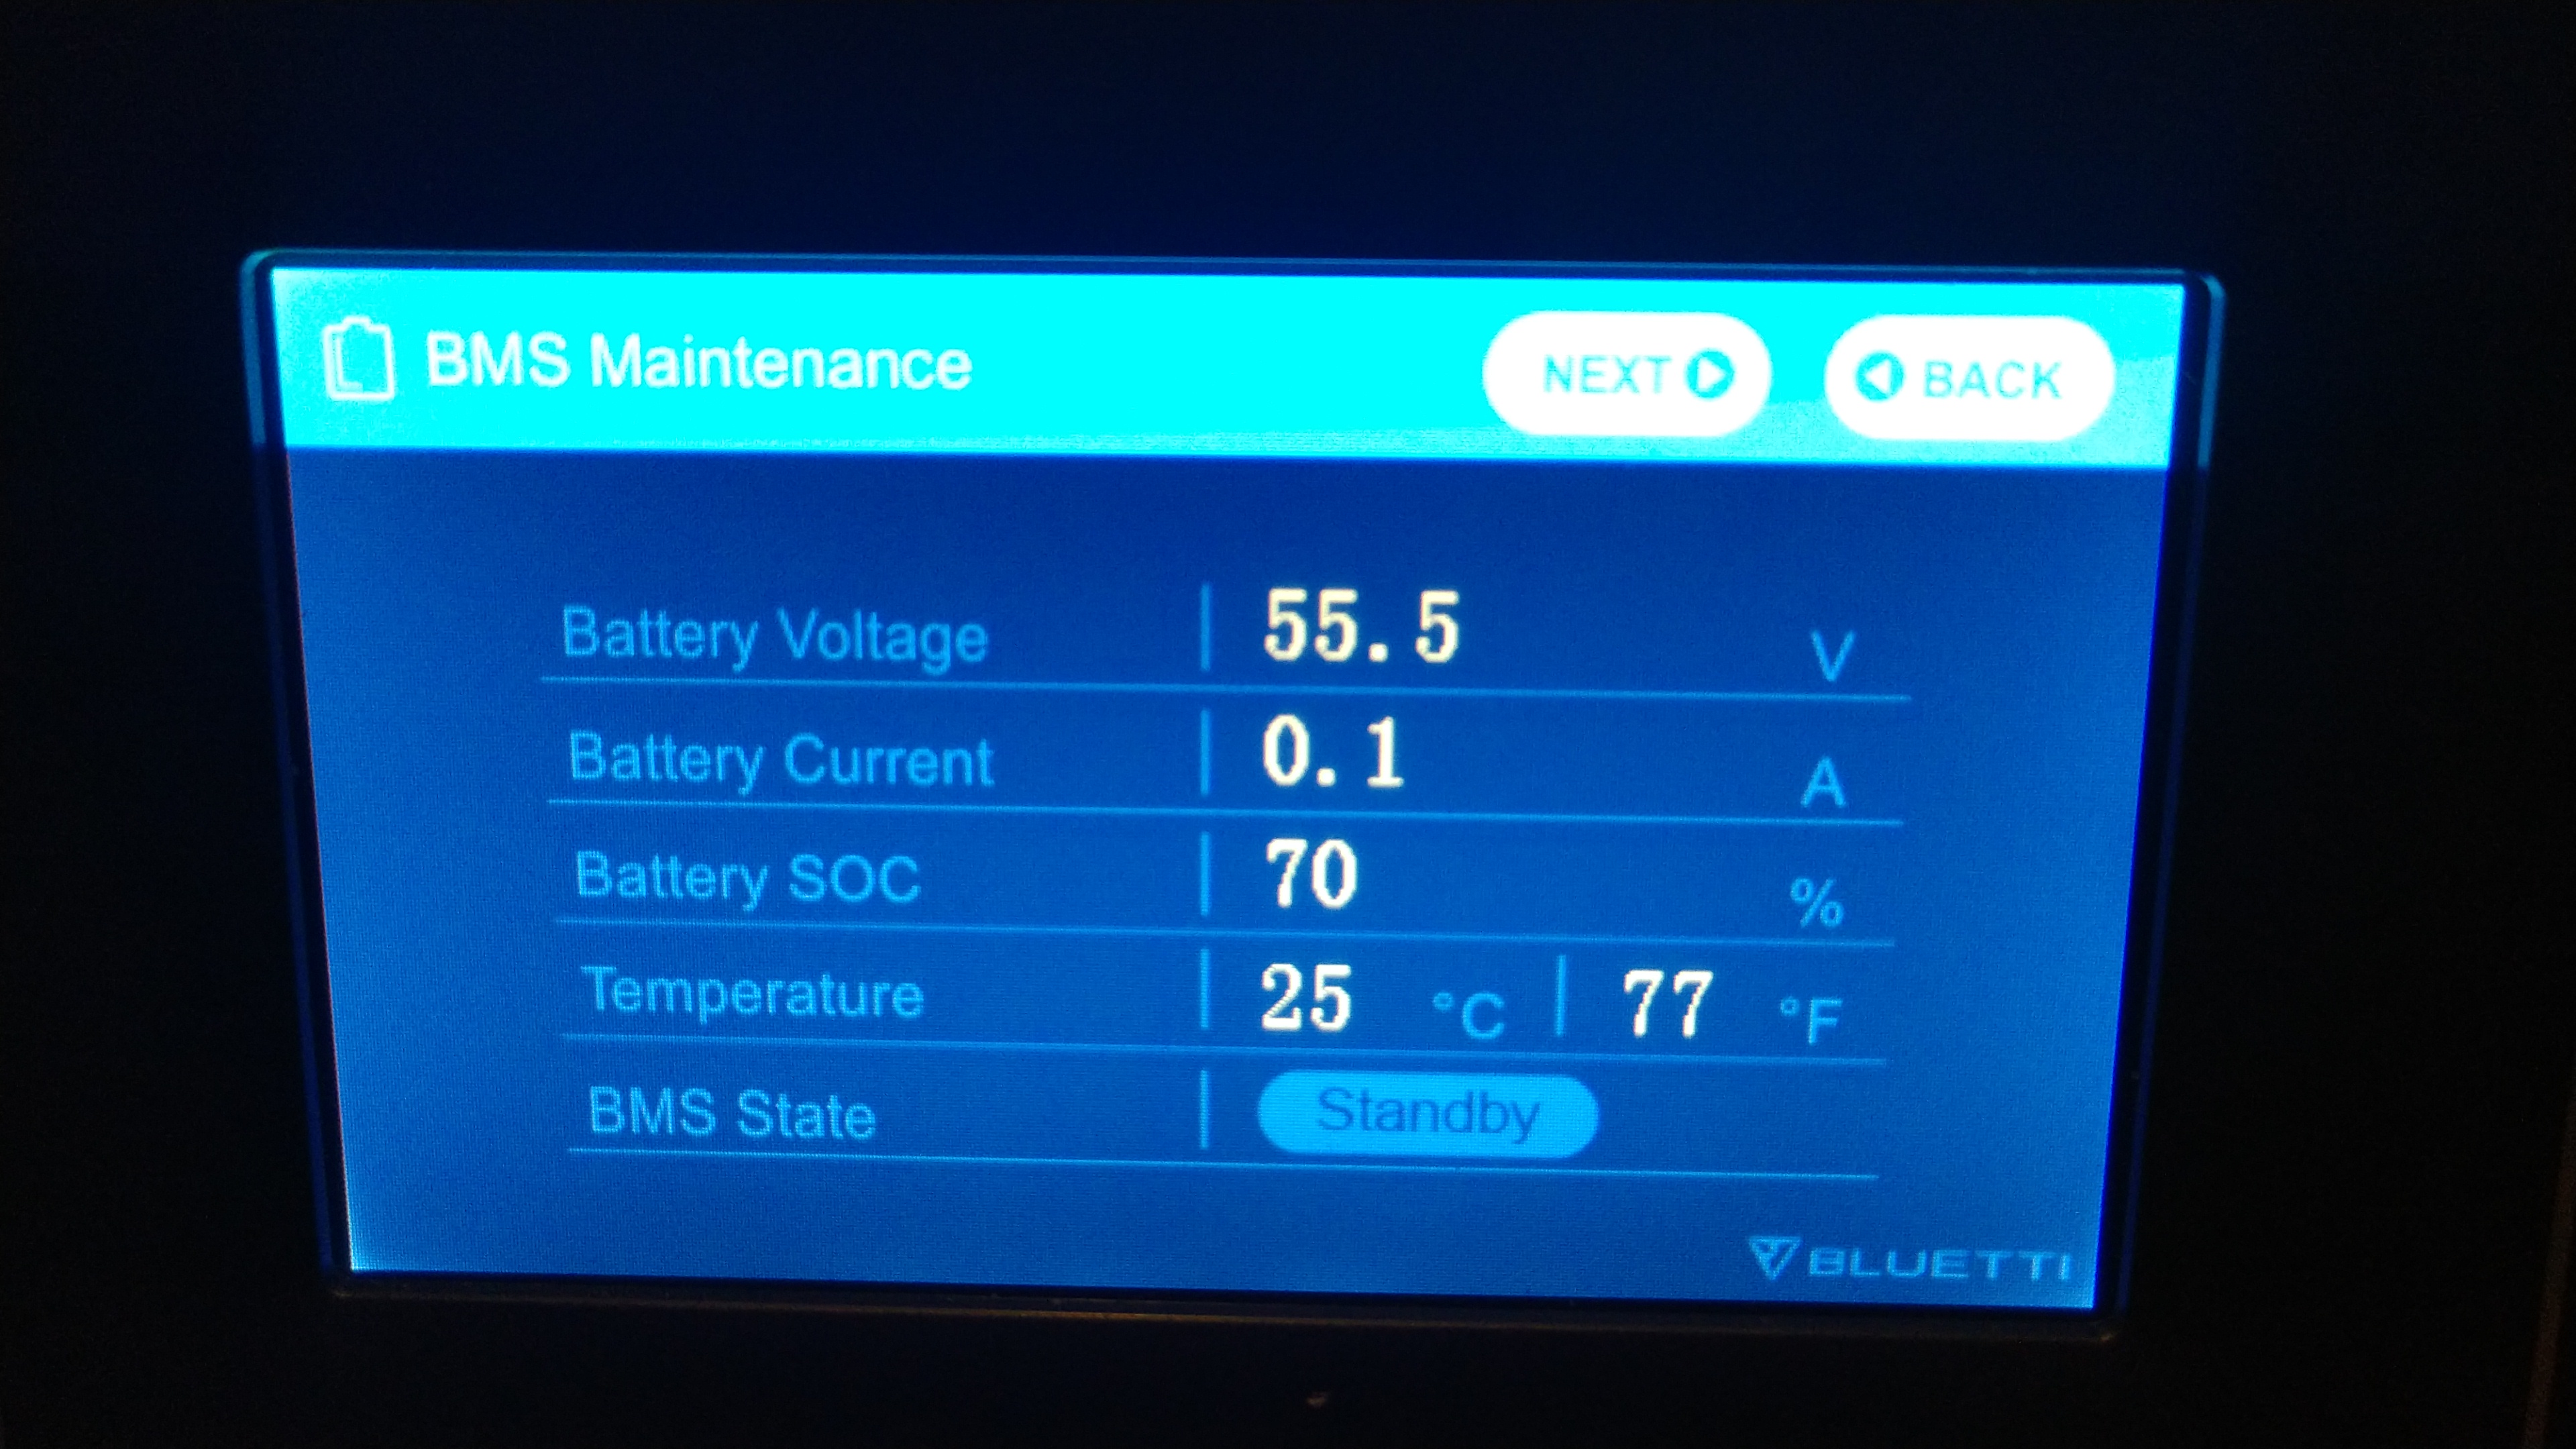
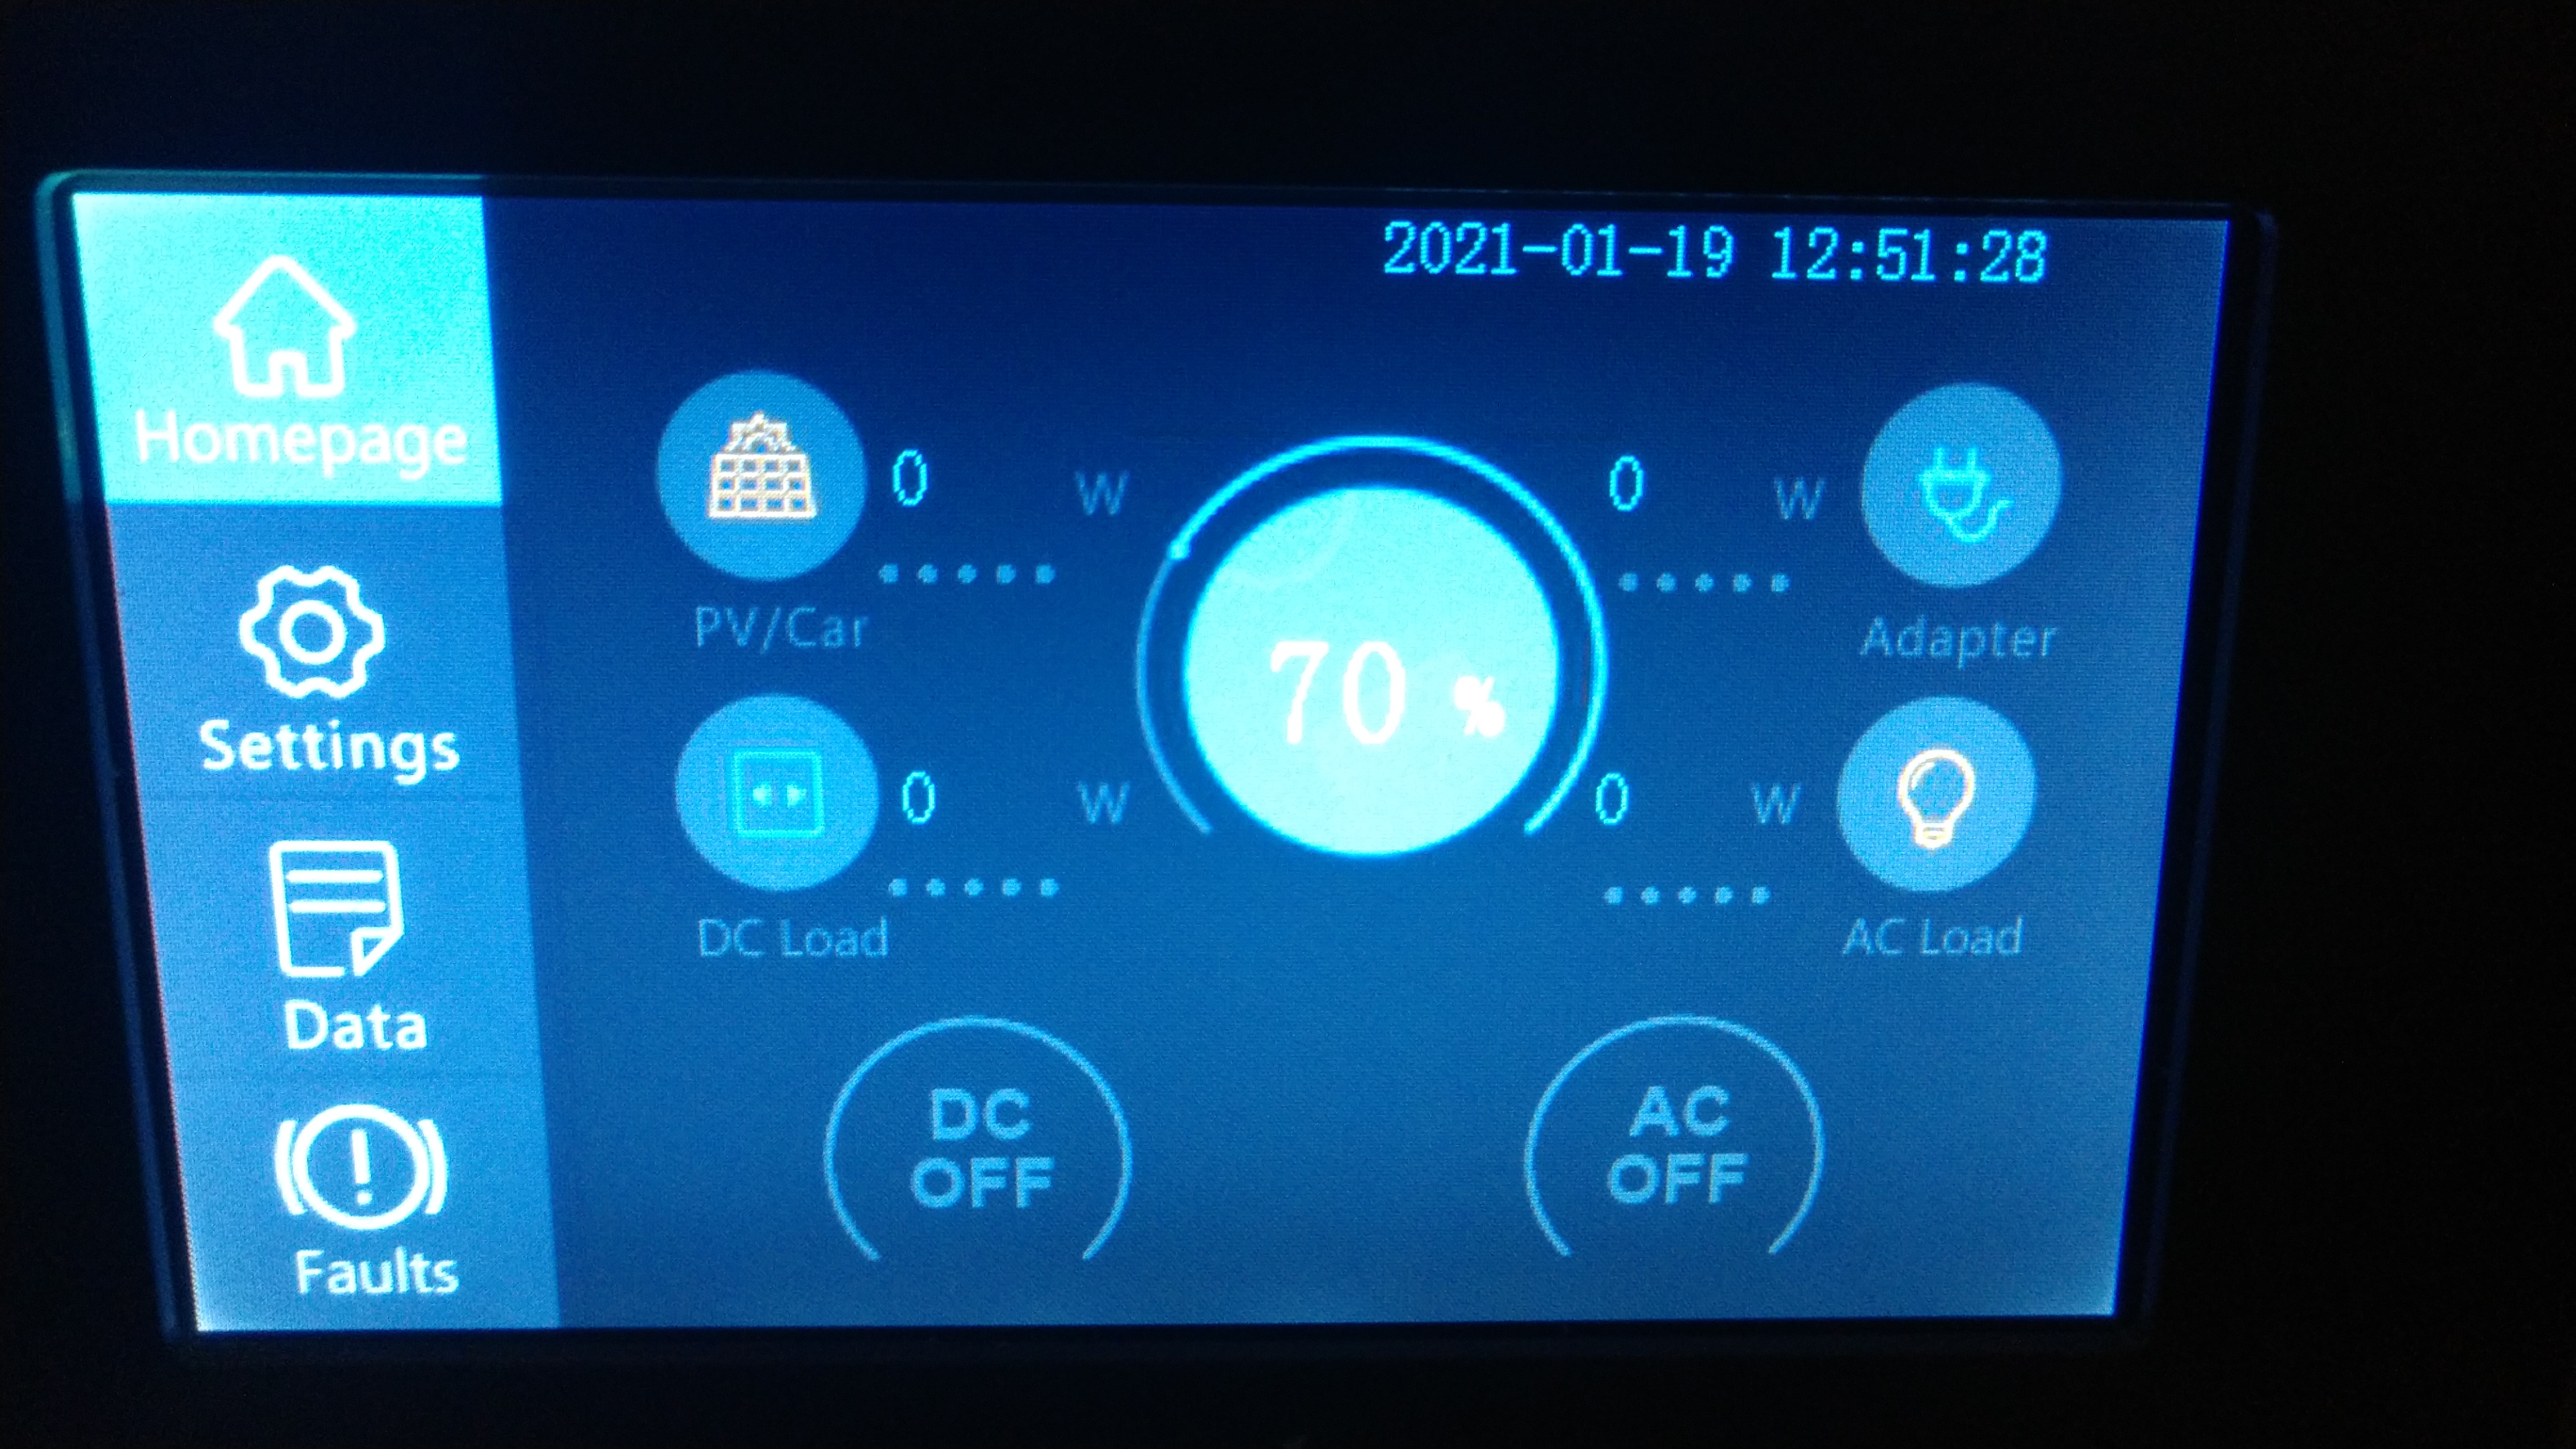
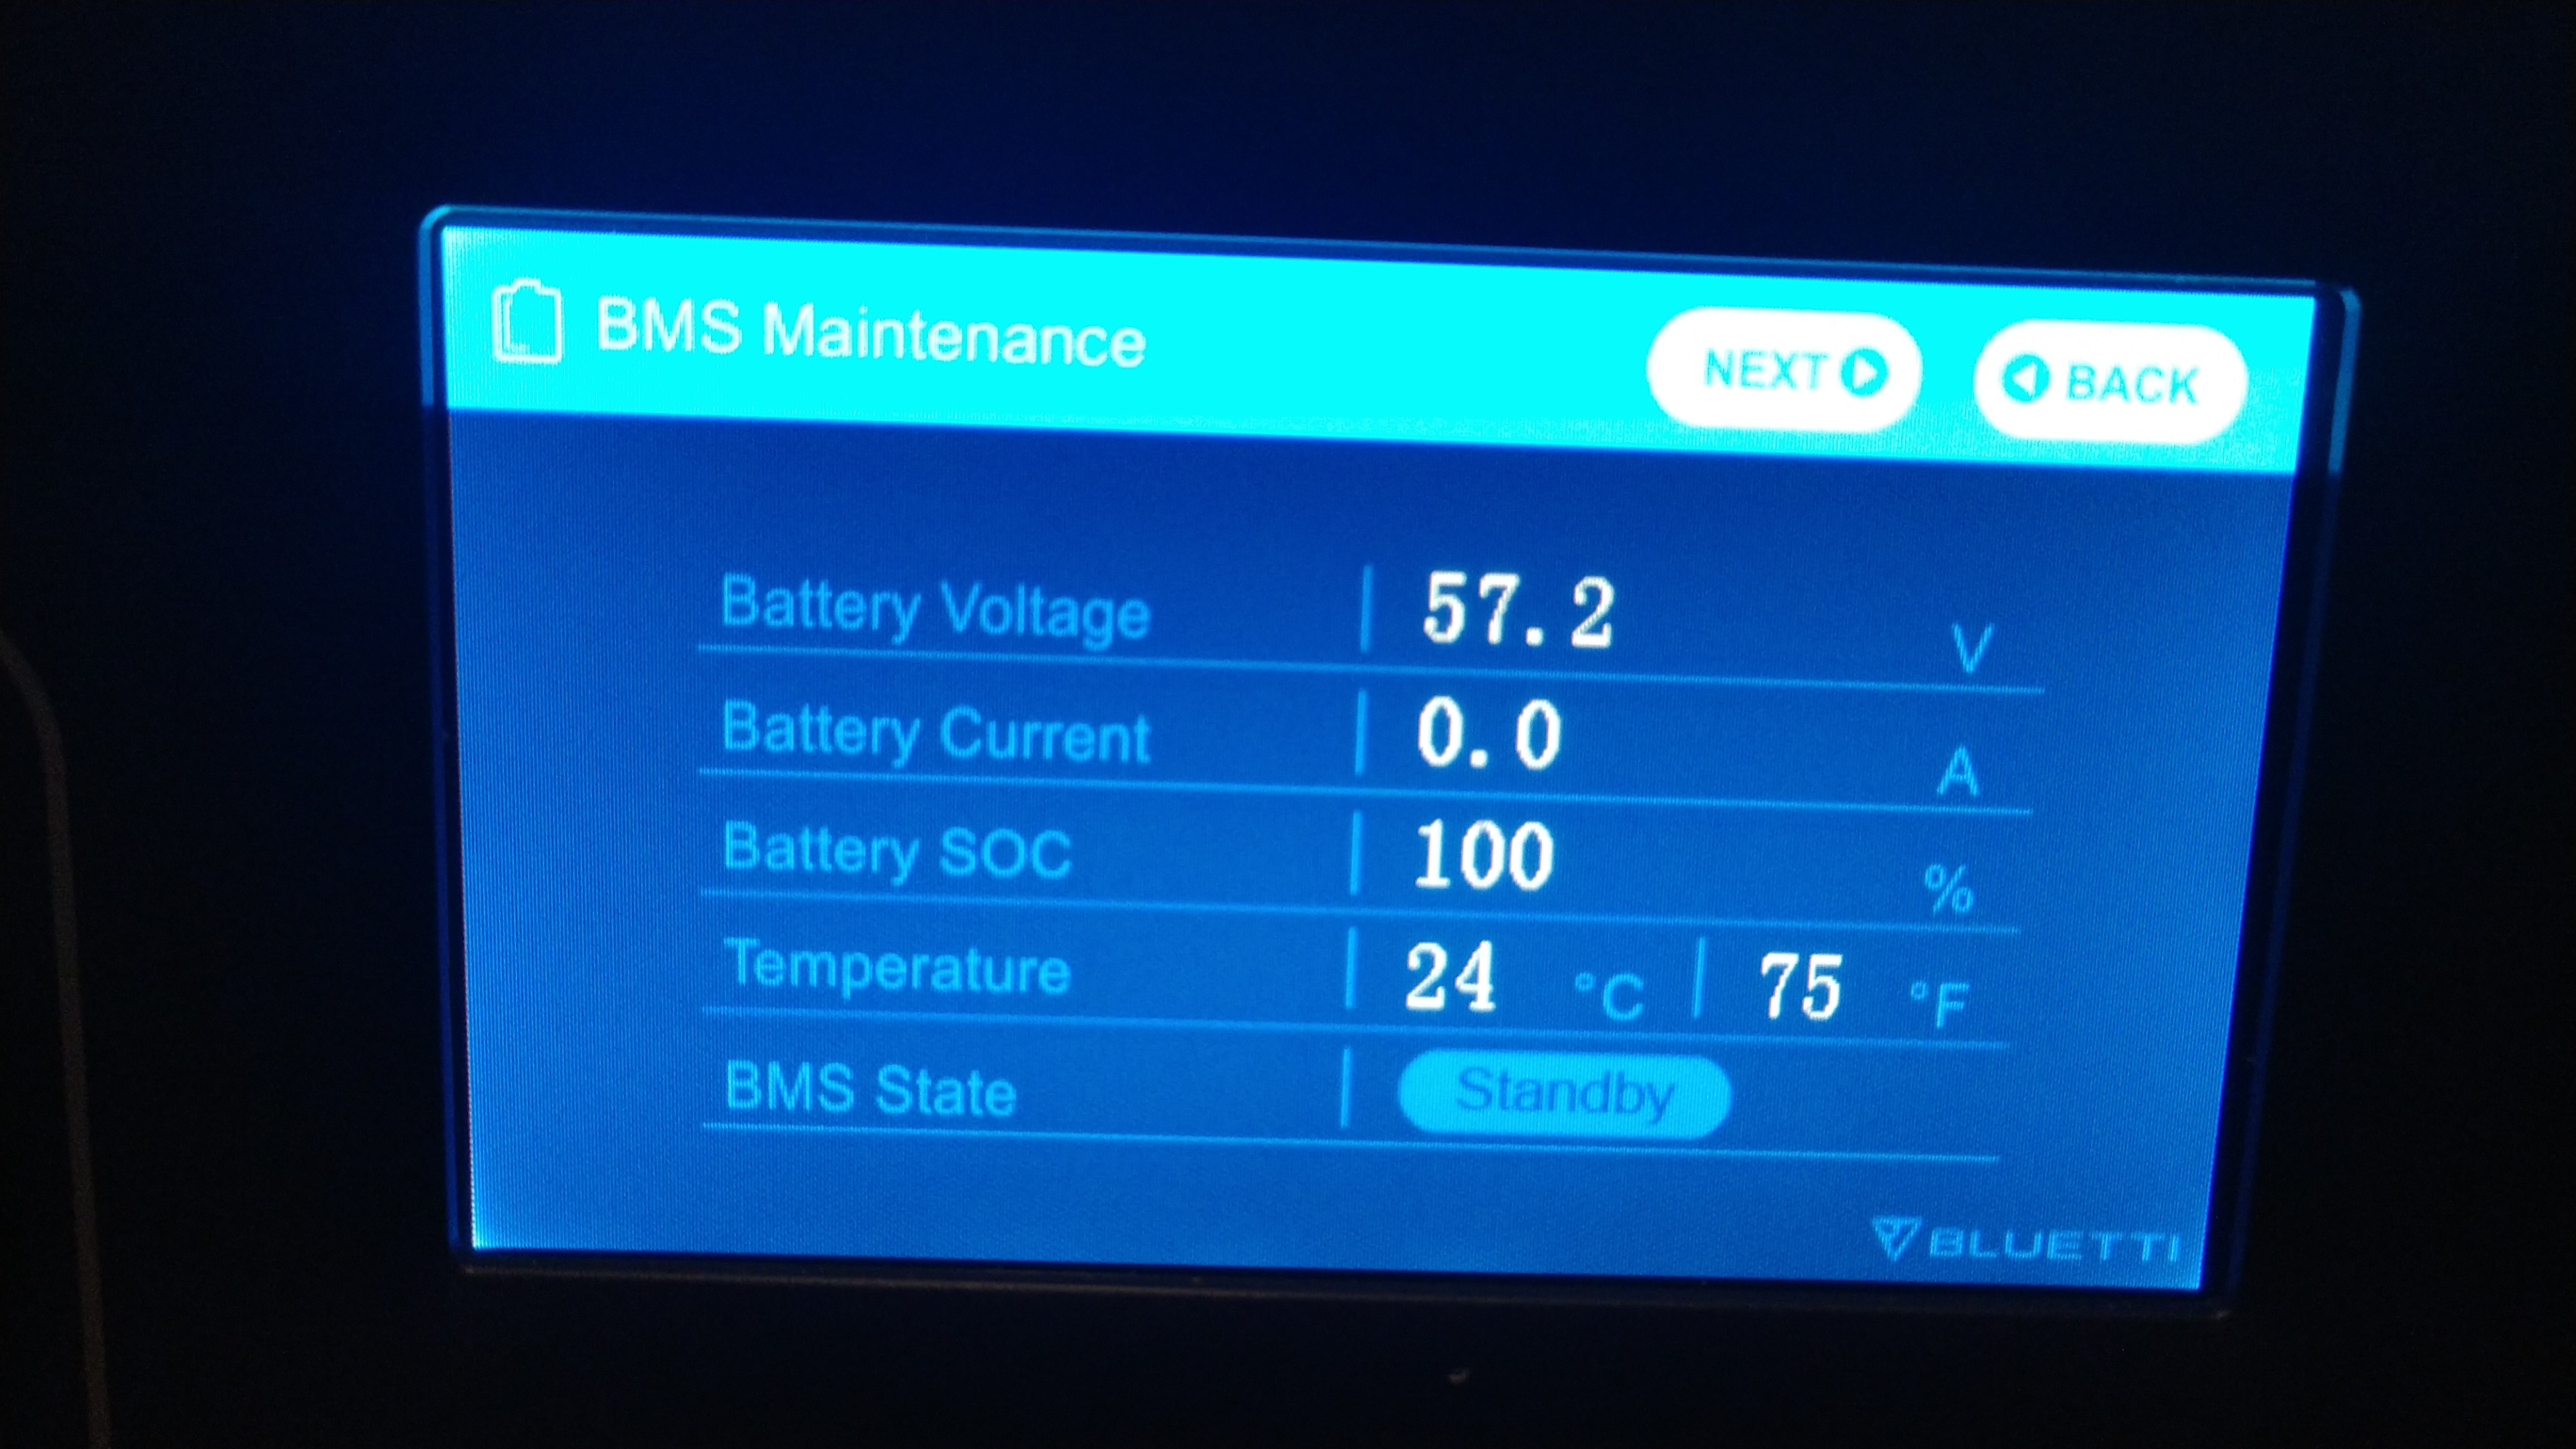
Well we’re doubling up again at the 48 hour mark. At the 24 hour mark, we had dropped from 100% to 91%, a 9% drop. Now the second 24 hours took it from 91% to 70%, or a 19% drop…approximately double the drain of the first 24 hours. Also note now there’s finally a 0.1 amp current drain displaying, where prior it was so low it was displaying 0.0.
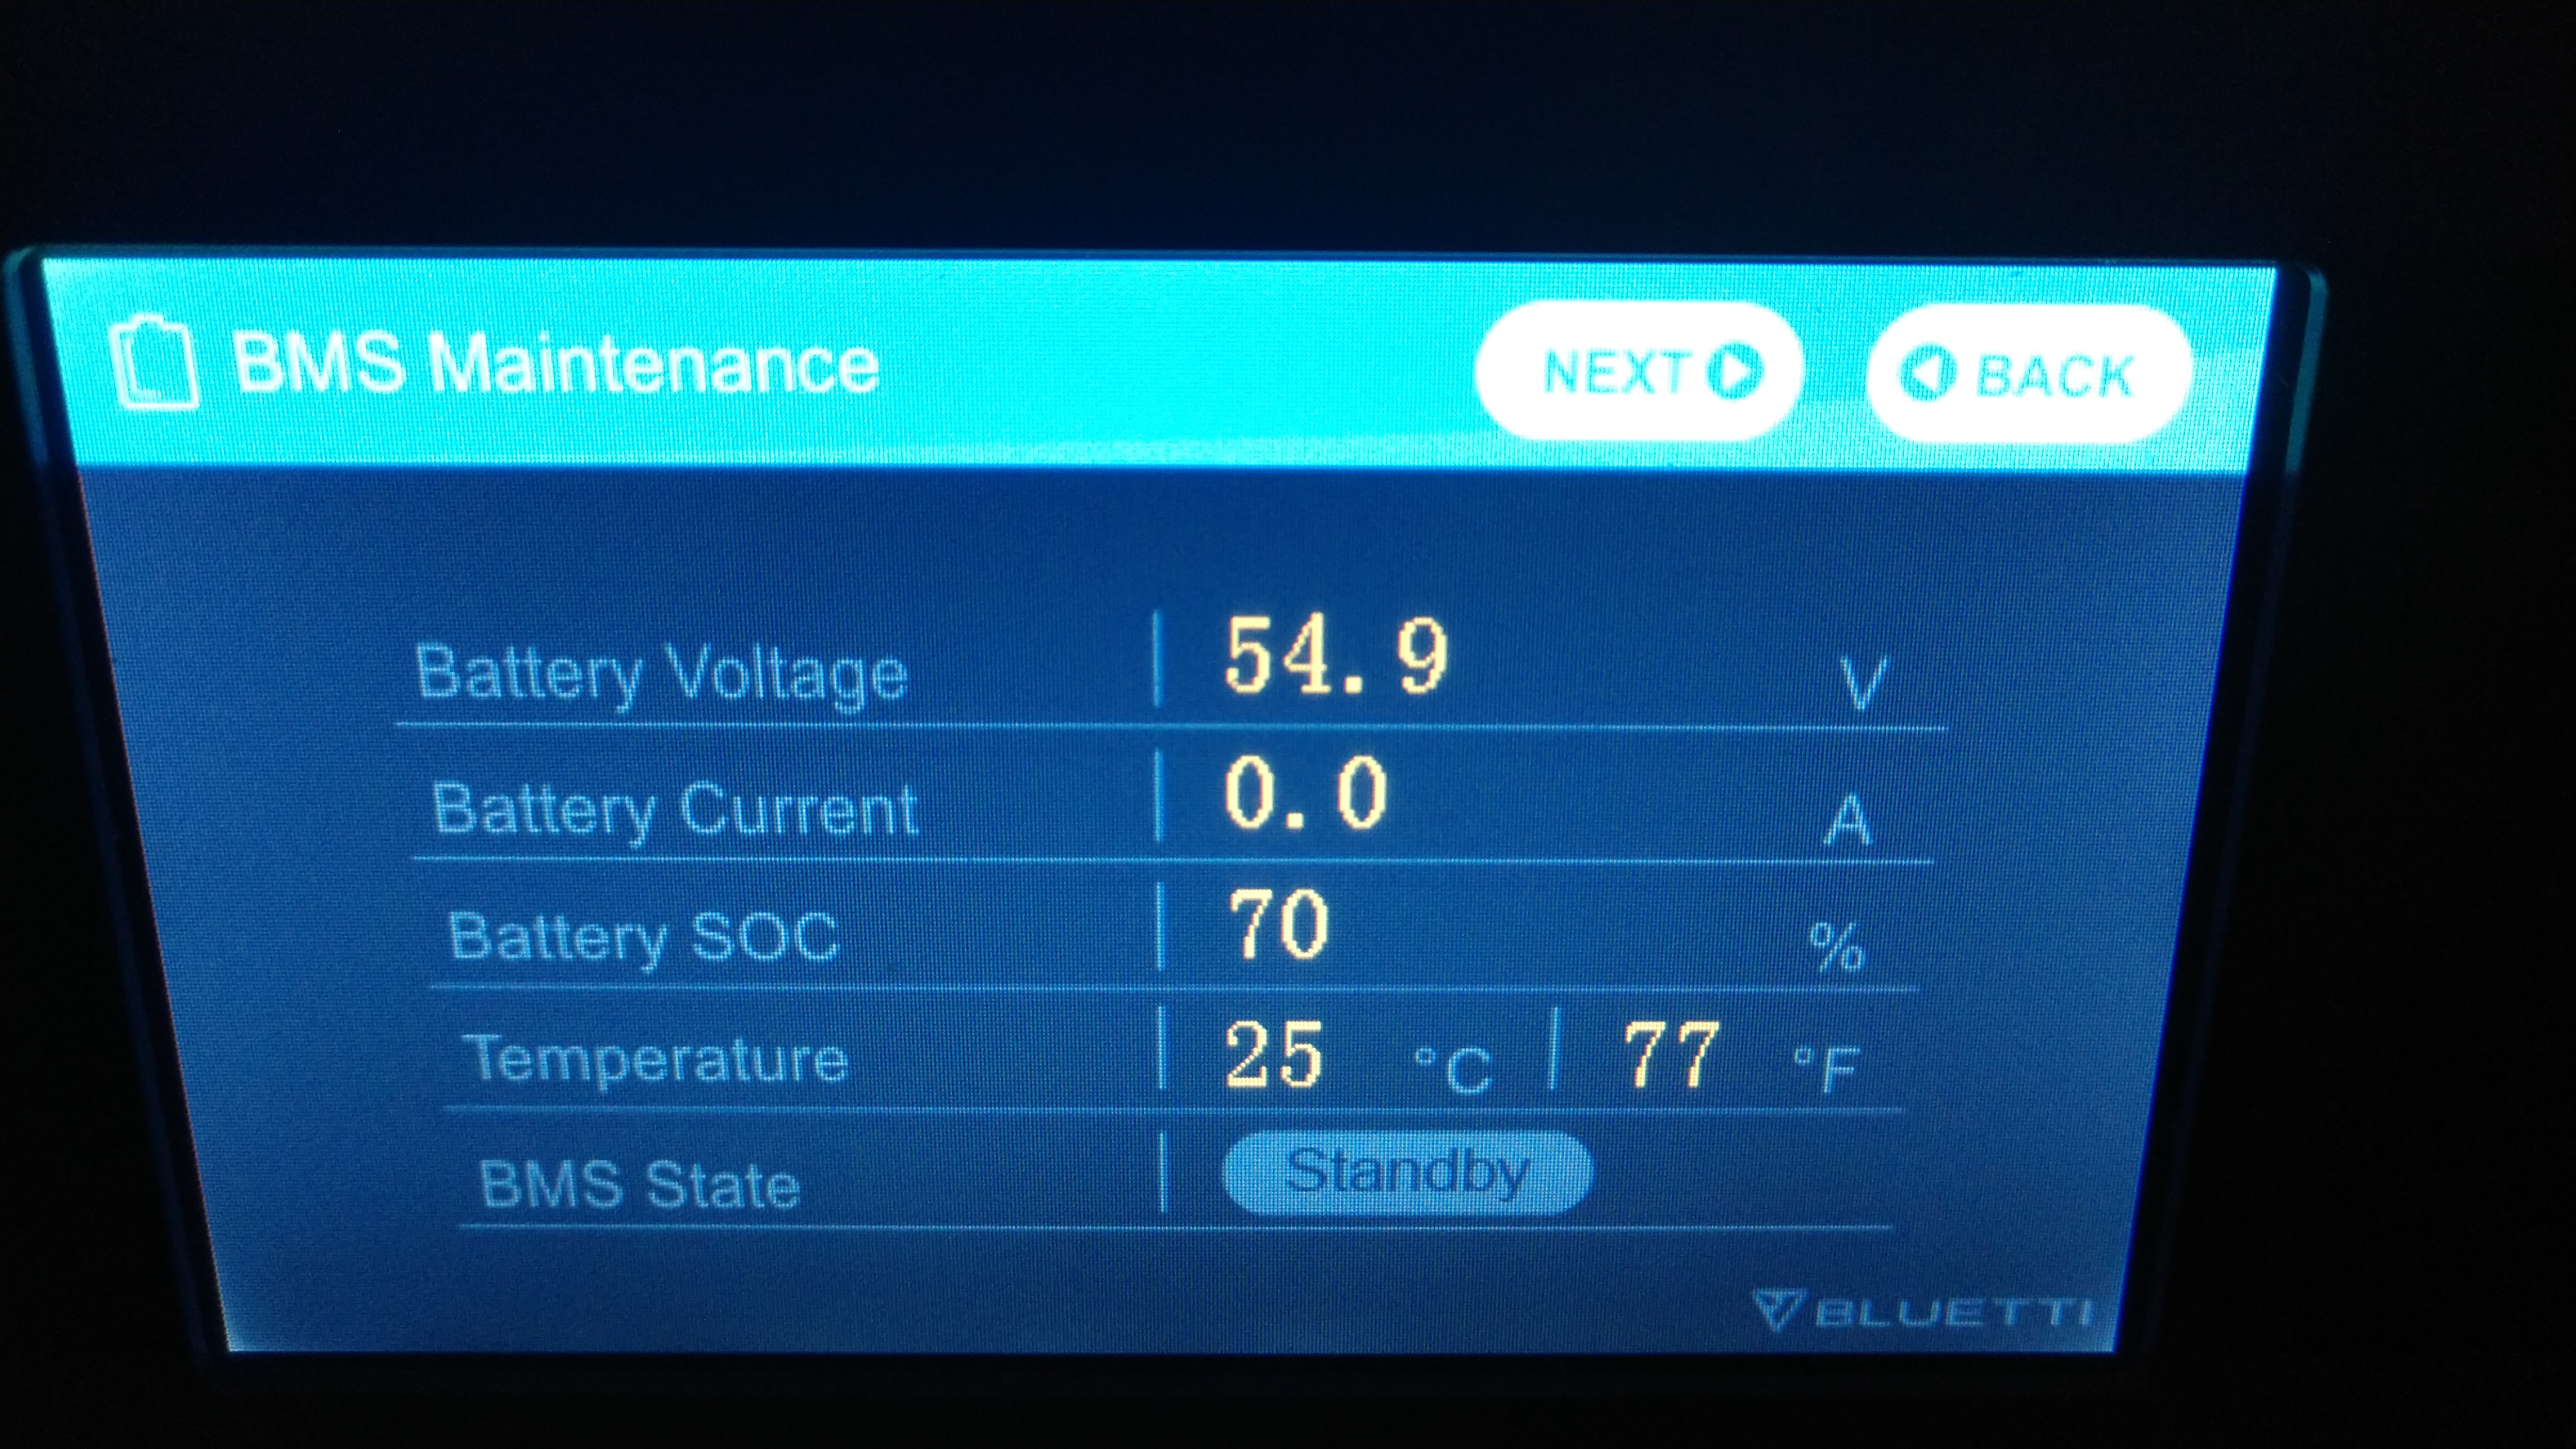
Ok. Someone explain this to me. After a loss of 19% in the last 24 hour test to a SOC of 70% posted above last night, I walk by my AC200 just now…15 hours later…and it still shows 70%!! Based on the last 24 hour test I would have expected it to drop, well, something. Very weird. Any ideas? Is the AC200 basing its % SOC on some programed voltage chart, rather than via a shunt?
OK, here is my best guess: The % of battery remaining is an estimate and is not always a specifically accurate representation of the SOC. I have a couple of ECO Flow R600 units that dance around somewhat on the SOC remaining as well. I have another brand of “Sogen” that does not have a % remaining display and only 5 status bars. The status bars can change somewhat when I turn it off and on again. Usually for the most part they are all fairly accurate. I do think they operate somewhat like automobile fuel gauges in that the Full to Empty is usually not linear and some portions of the 0 to 100% run faster than others at times.
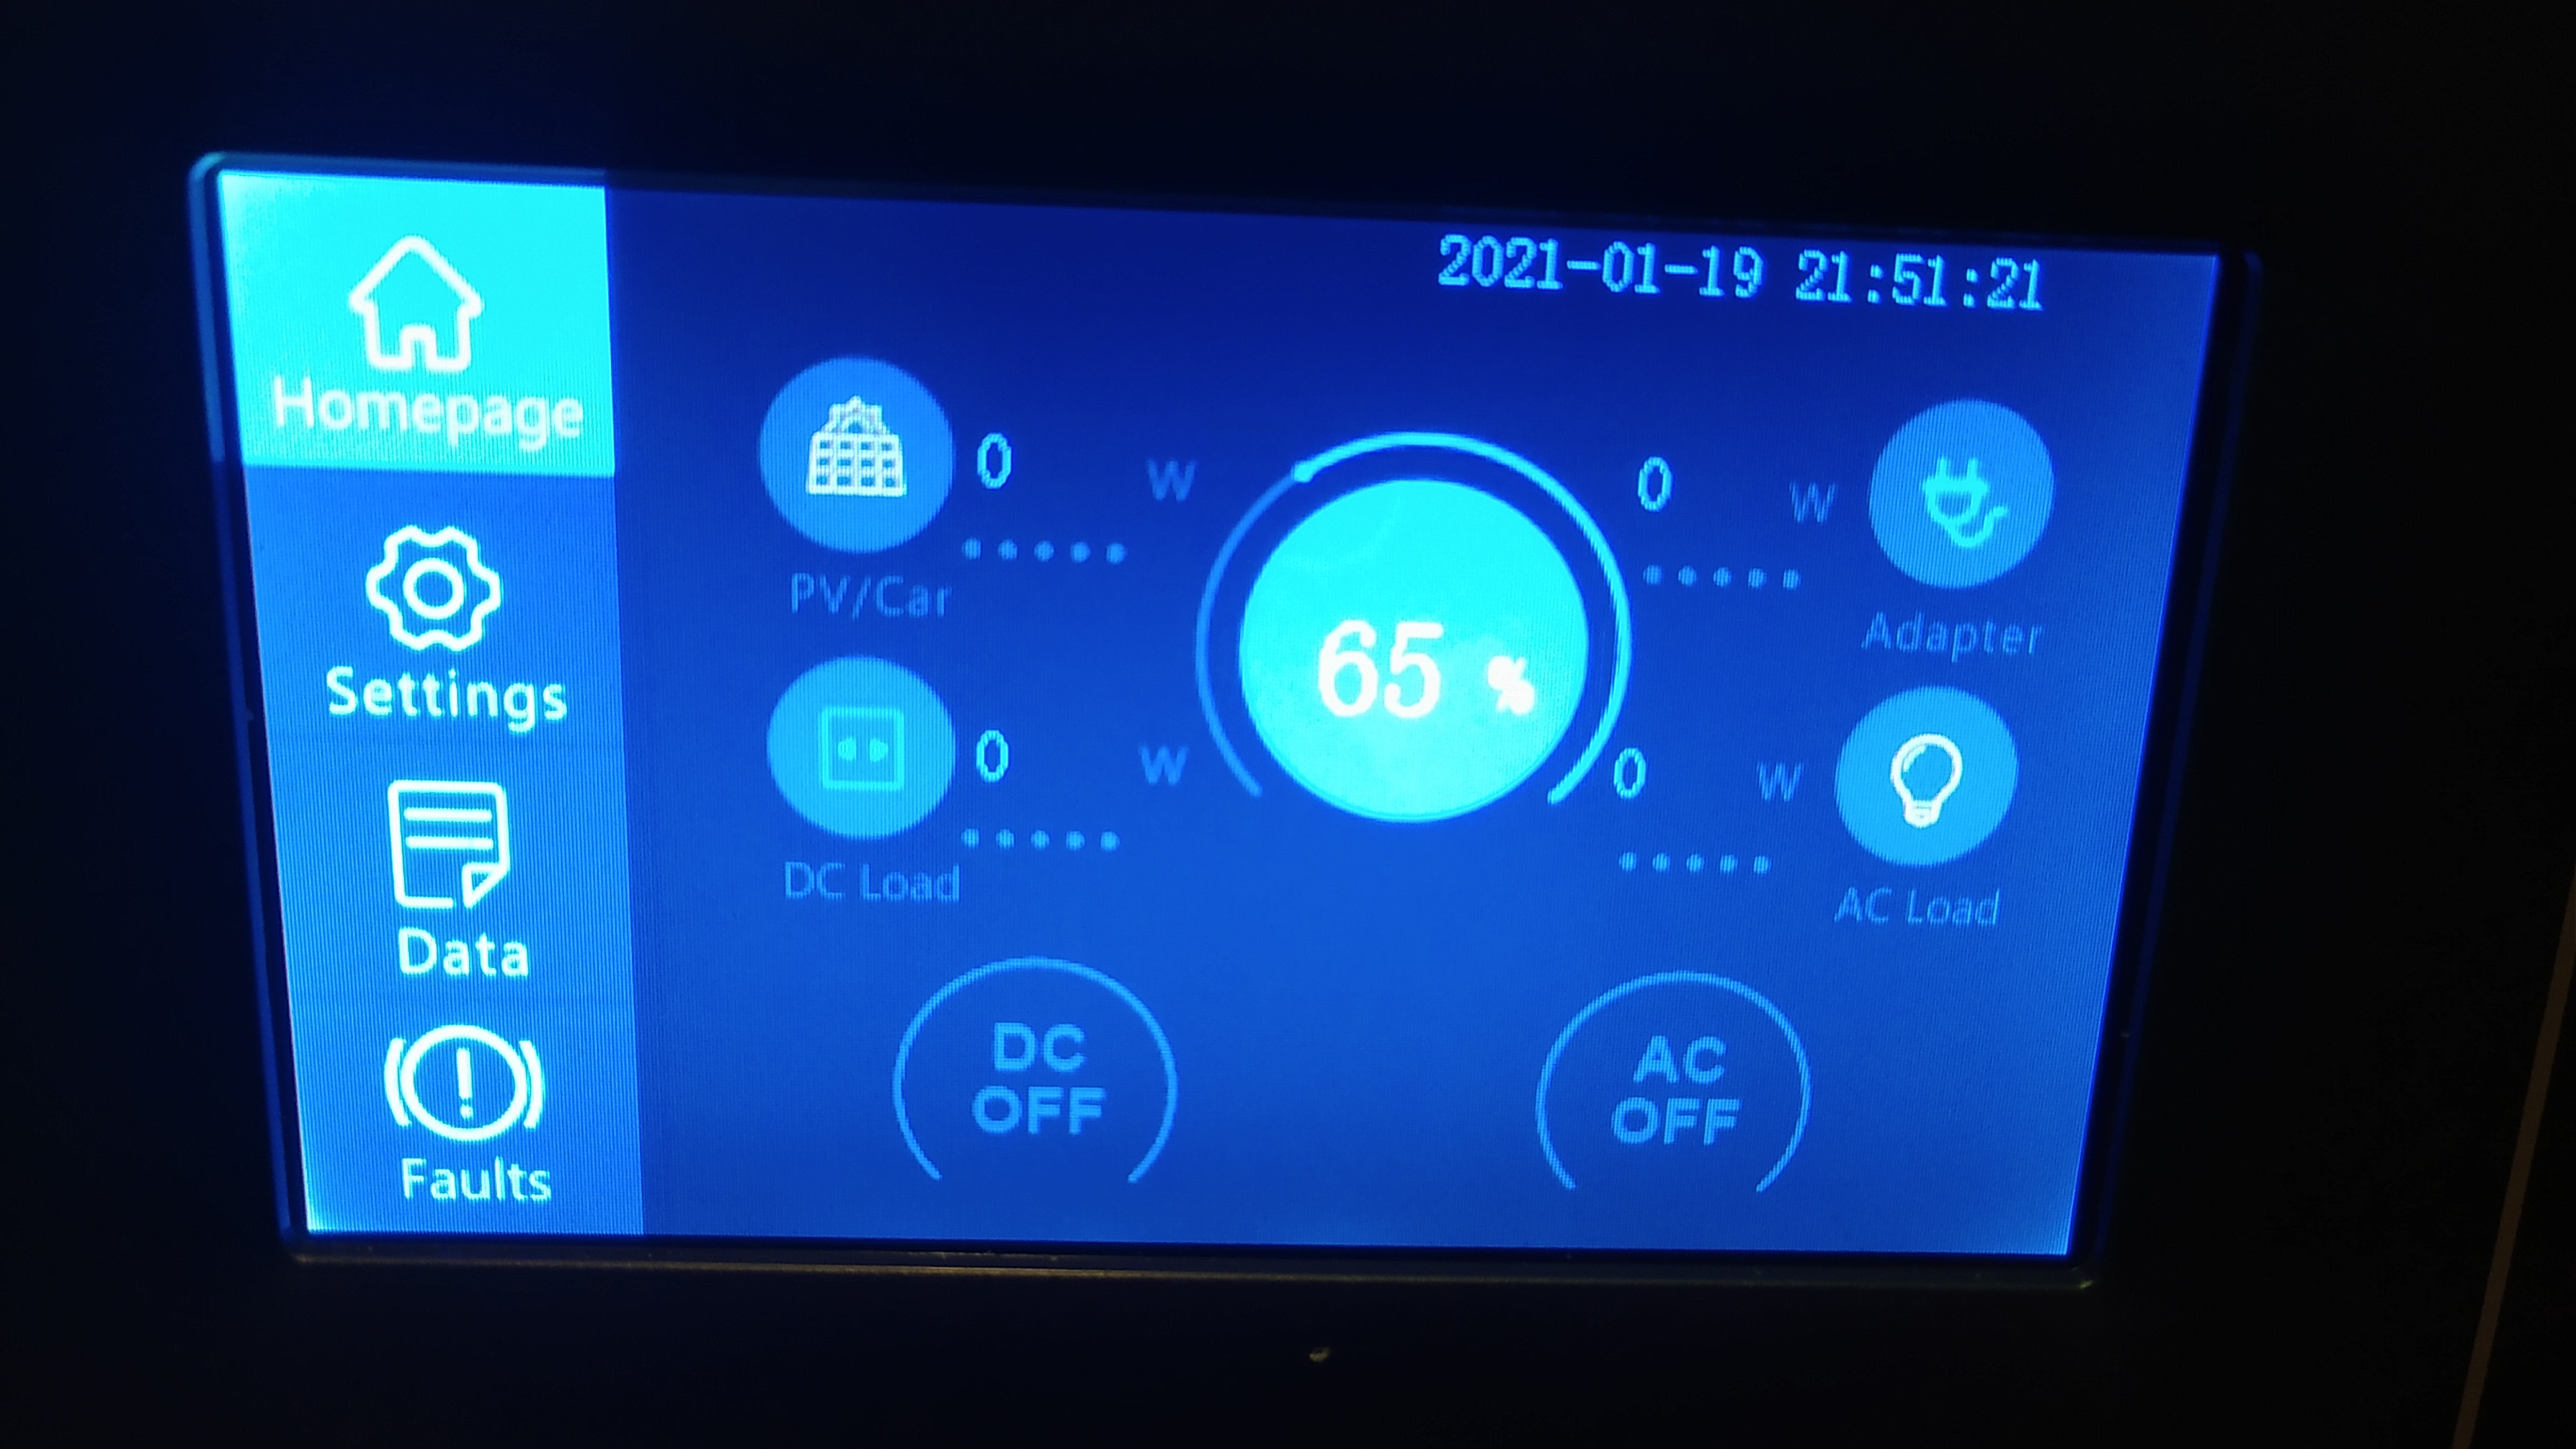
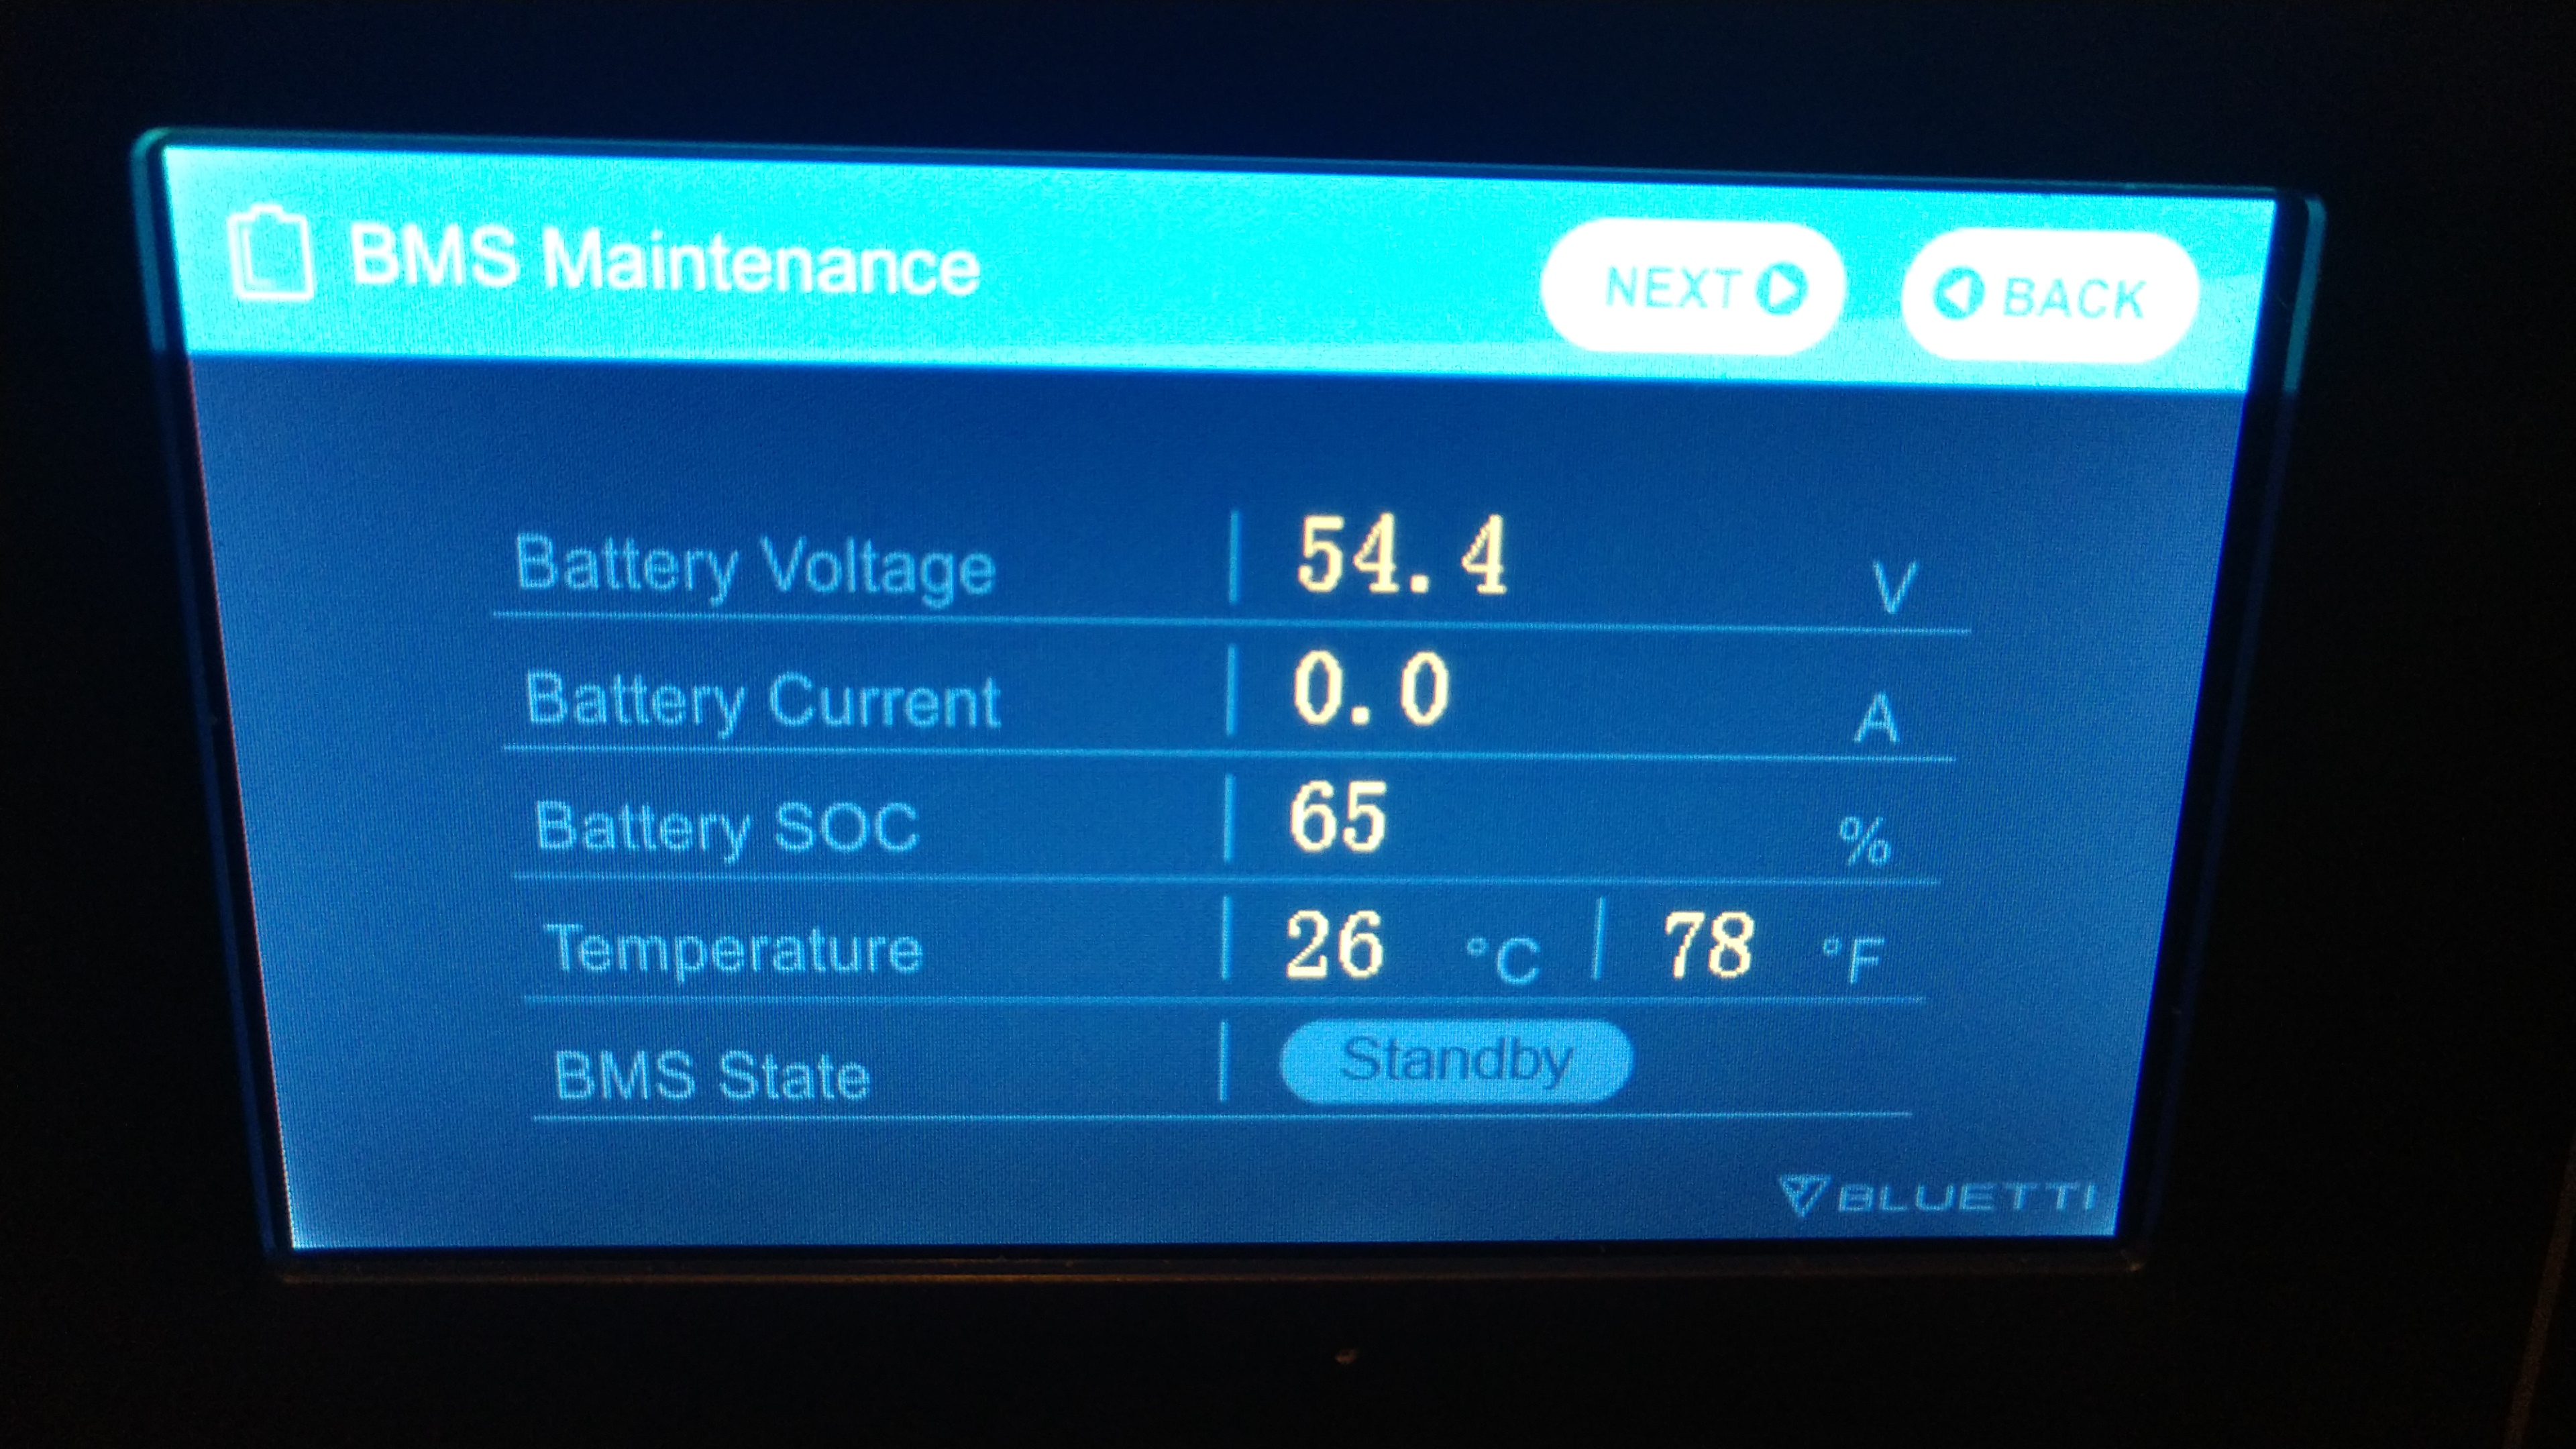
It’s time for the 72 hour reading, and it’s anyone’s guess! ![]() In the 24 hours since the last reading, it’s dropped only 5% this time…down to 65% SOC (or whatever that % display actually means
In the 24 hours since the last reading, it’s dropped only 5% this time…down to 65% SOC (or whatever that % display actually means ![]() ).
).
Great info that took lots of patience  It looks like the original reports of the AC200 drawing very little standby wattage (6 to 7 watts) was accurate and the SOC screen percentage is not always accurate but a guide instead.
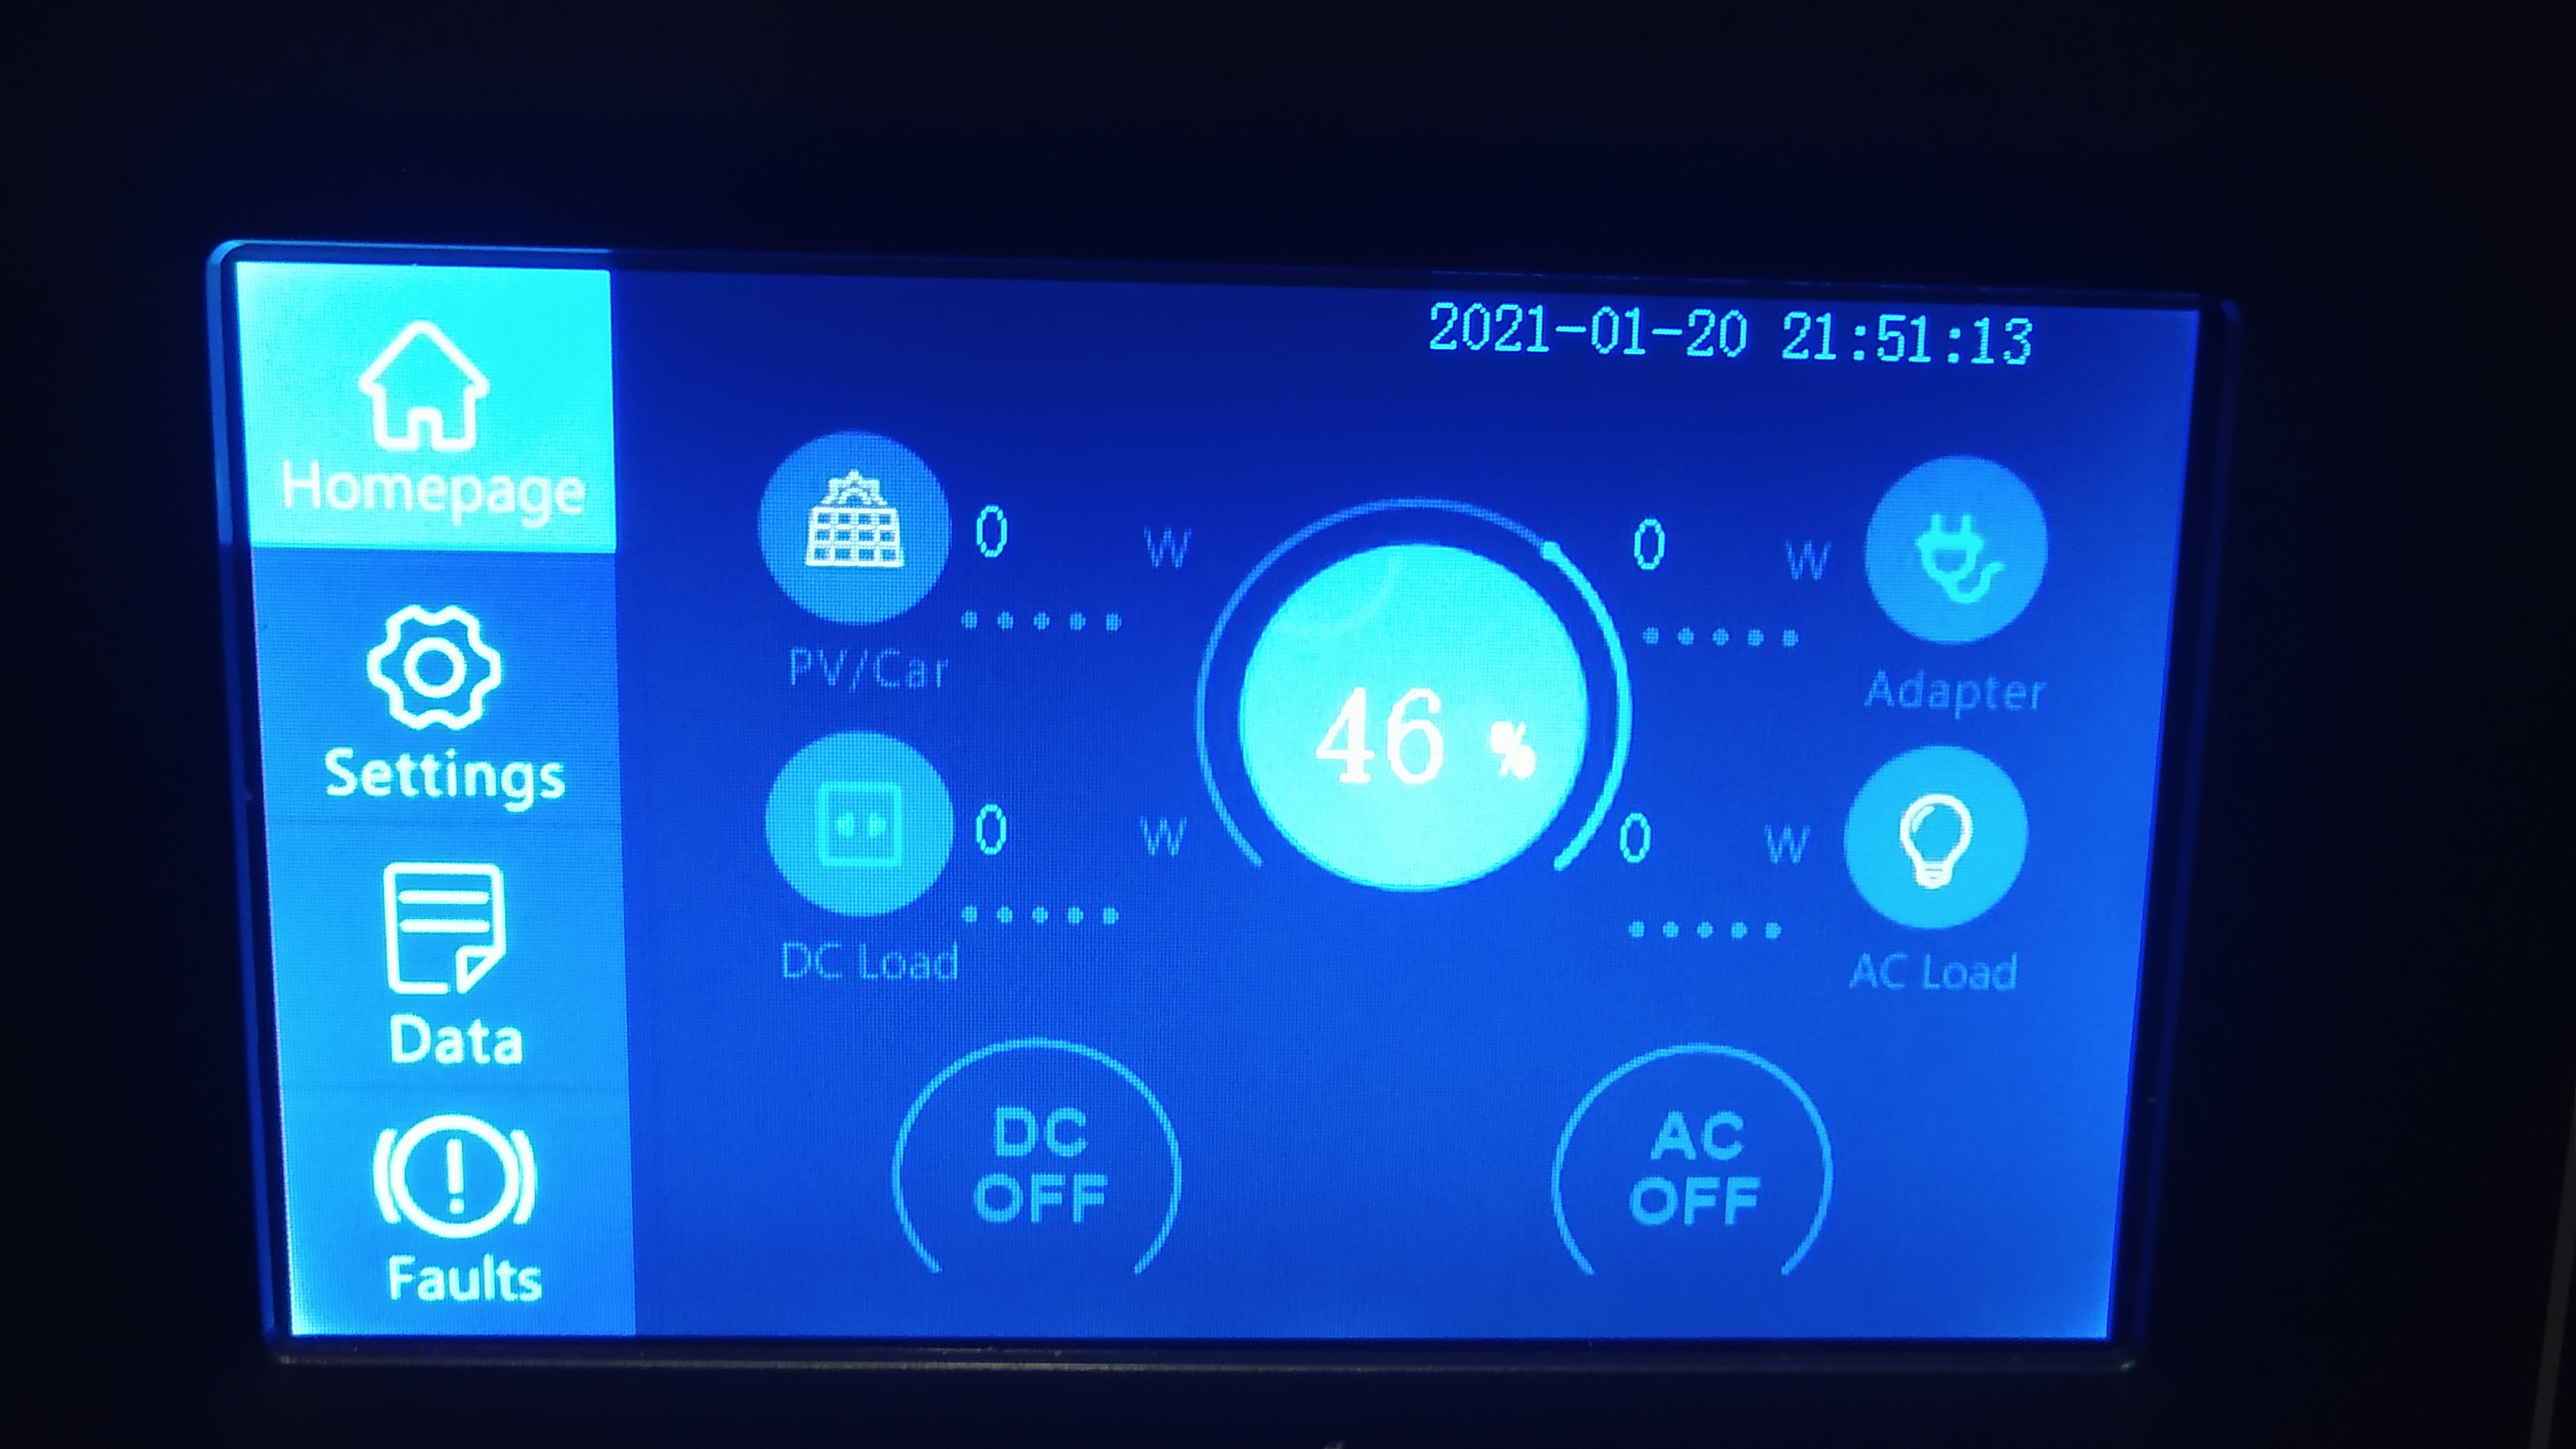
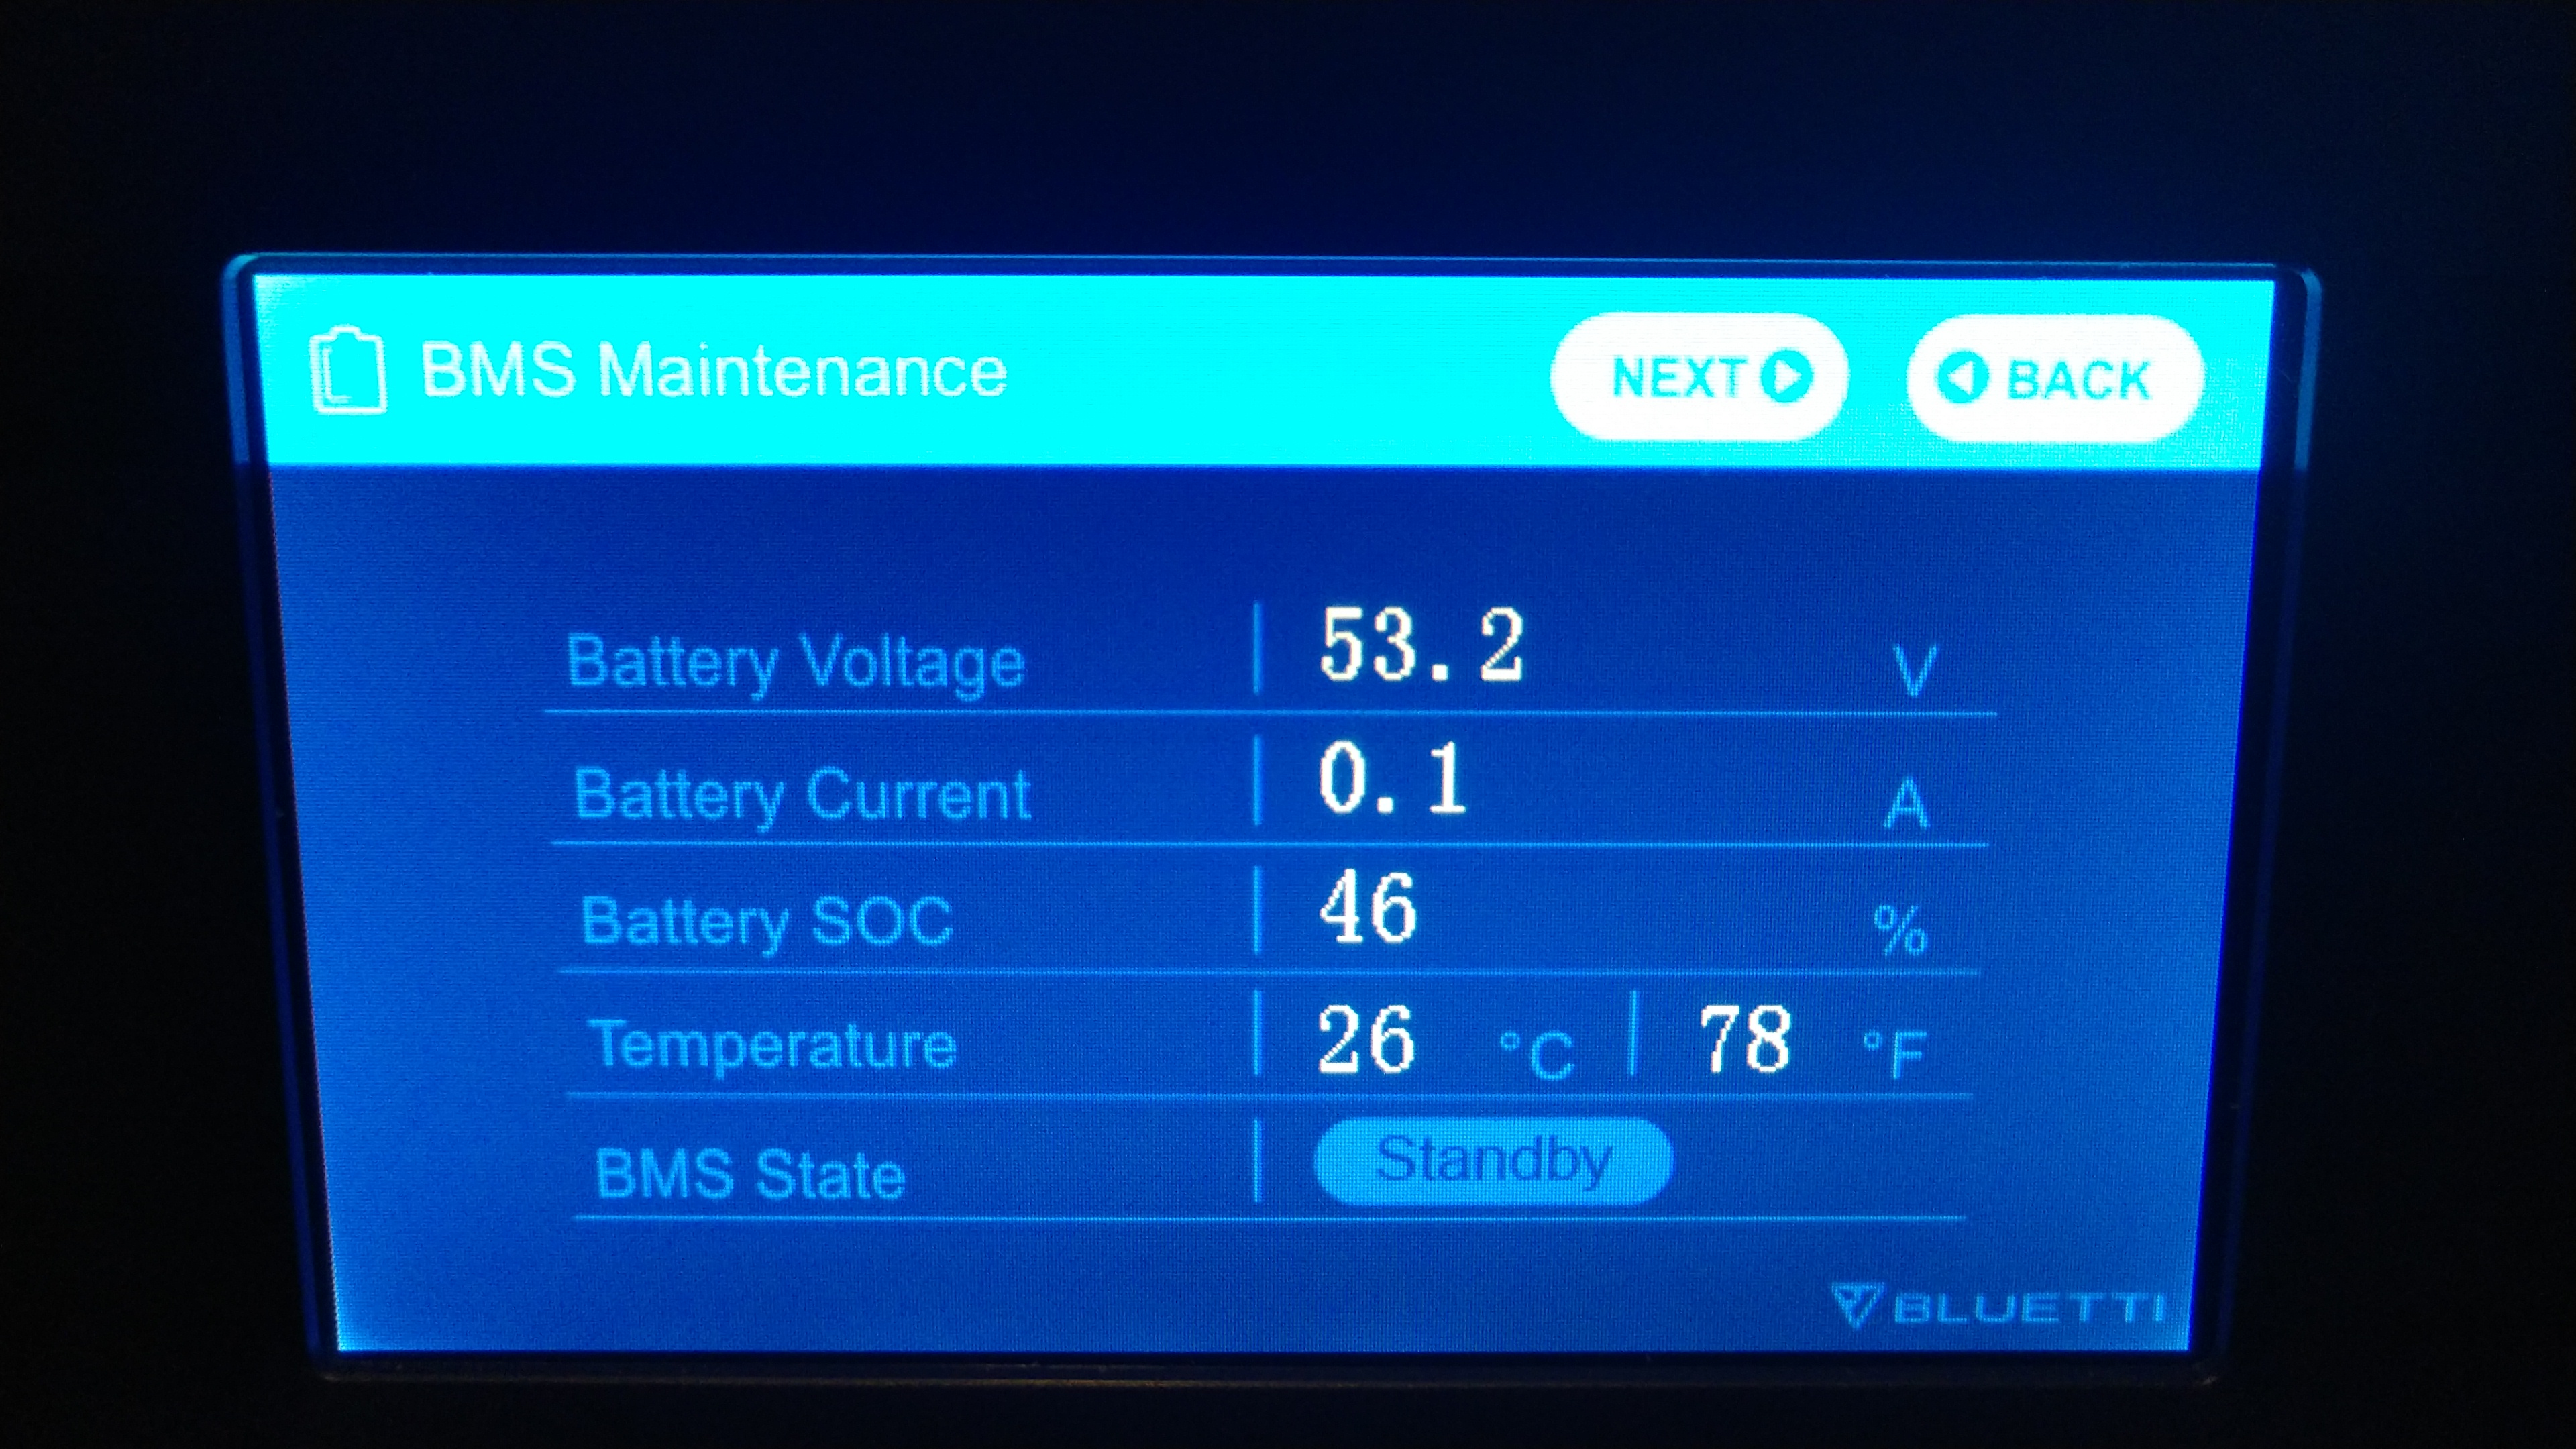
It’s 96 hours folks, and the SOC Guess-O-Meter™ is showing 46%. That’s a drop of 19% in the last 24 hours, for those of you following this roller coaster ride. ![]()
thanks for the update, I have been running around a lot this week. I will be trying to call them today as I have not heard back from support
Ben
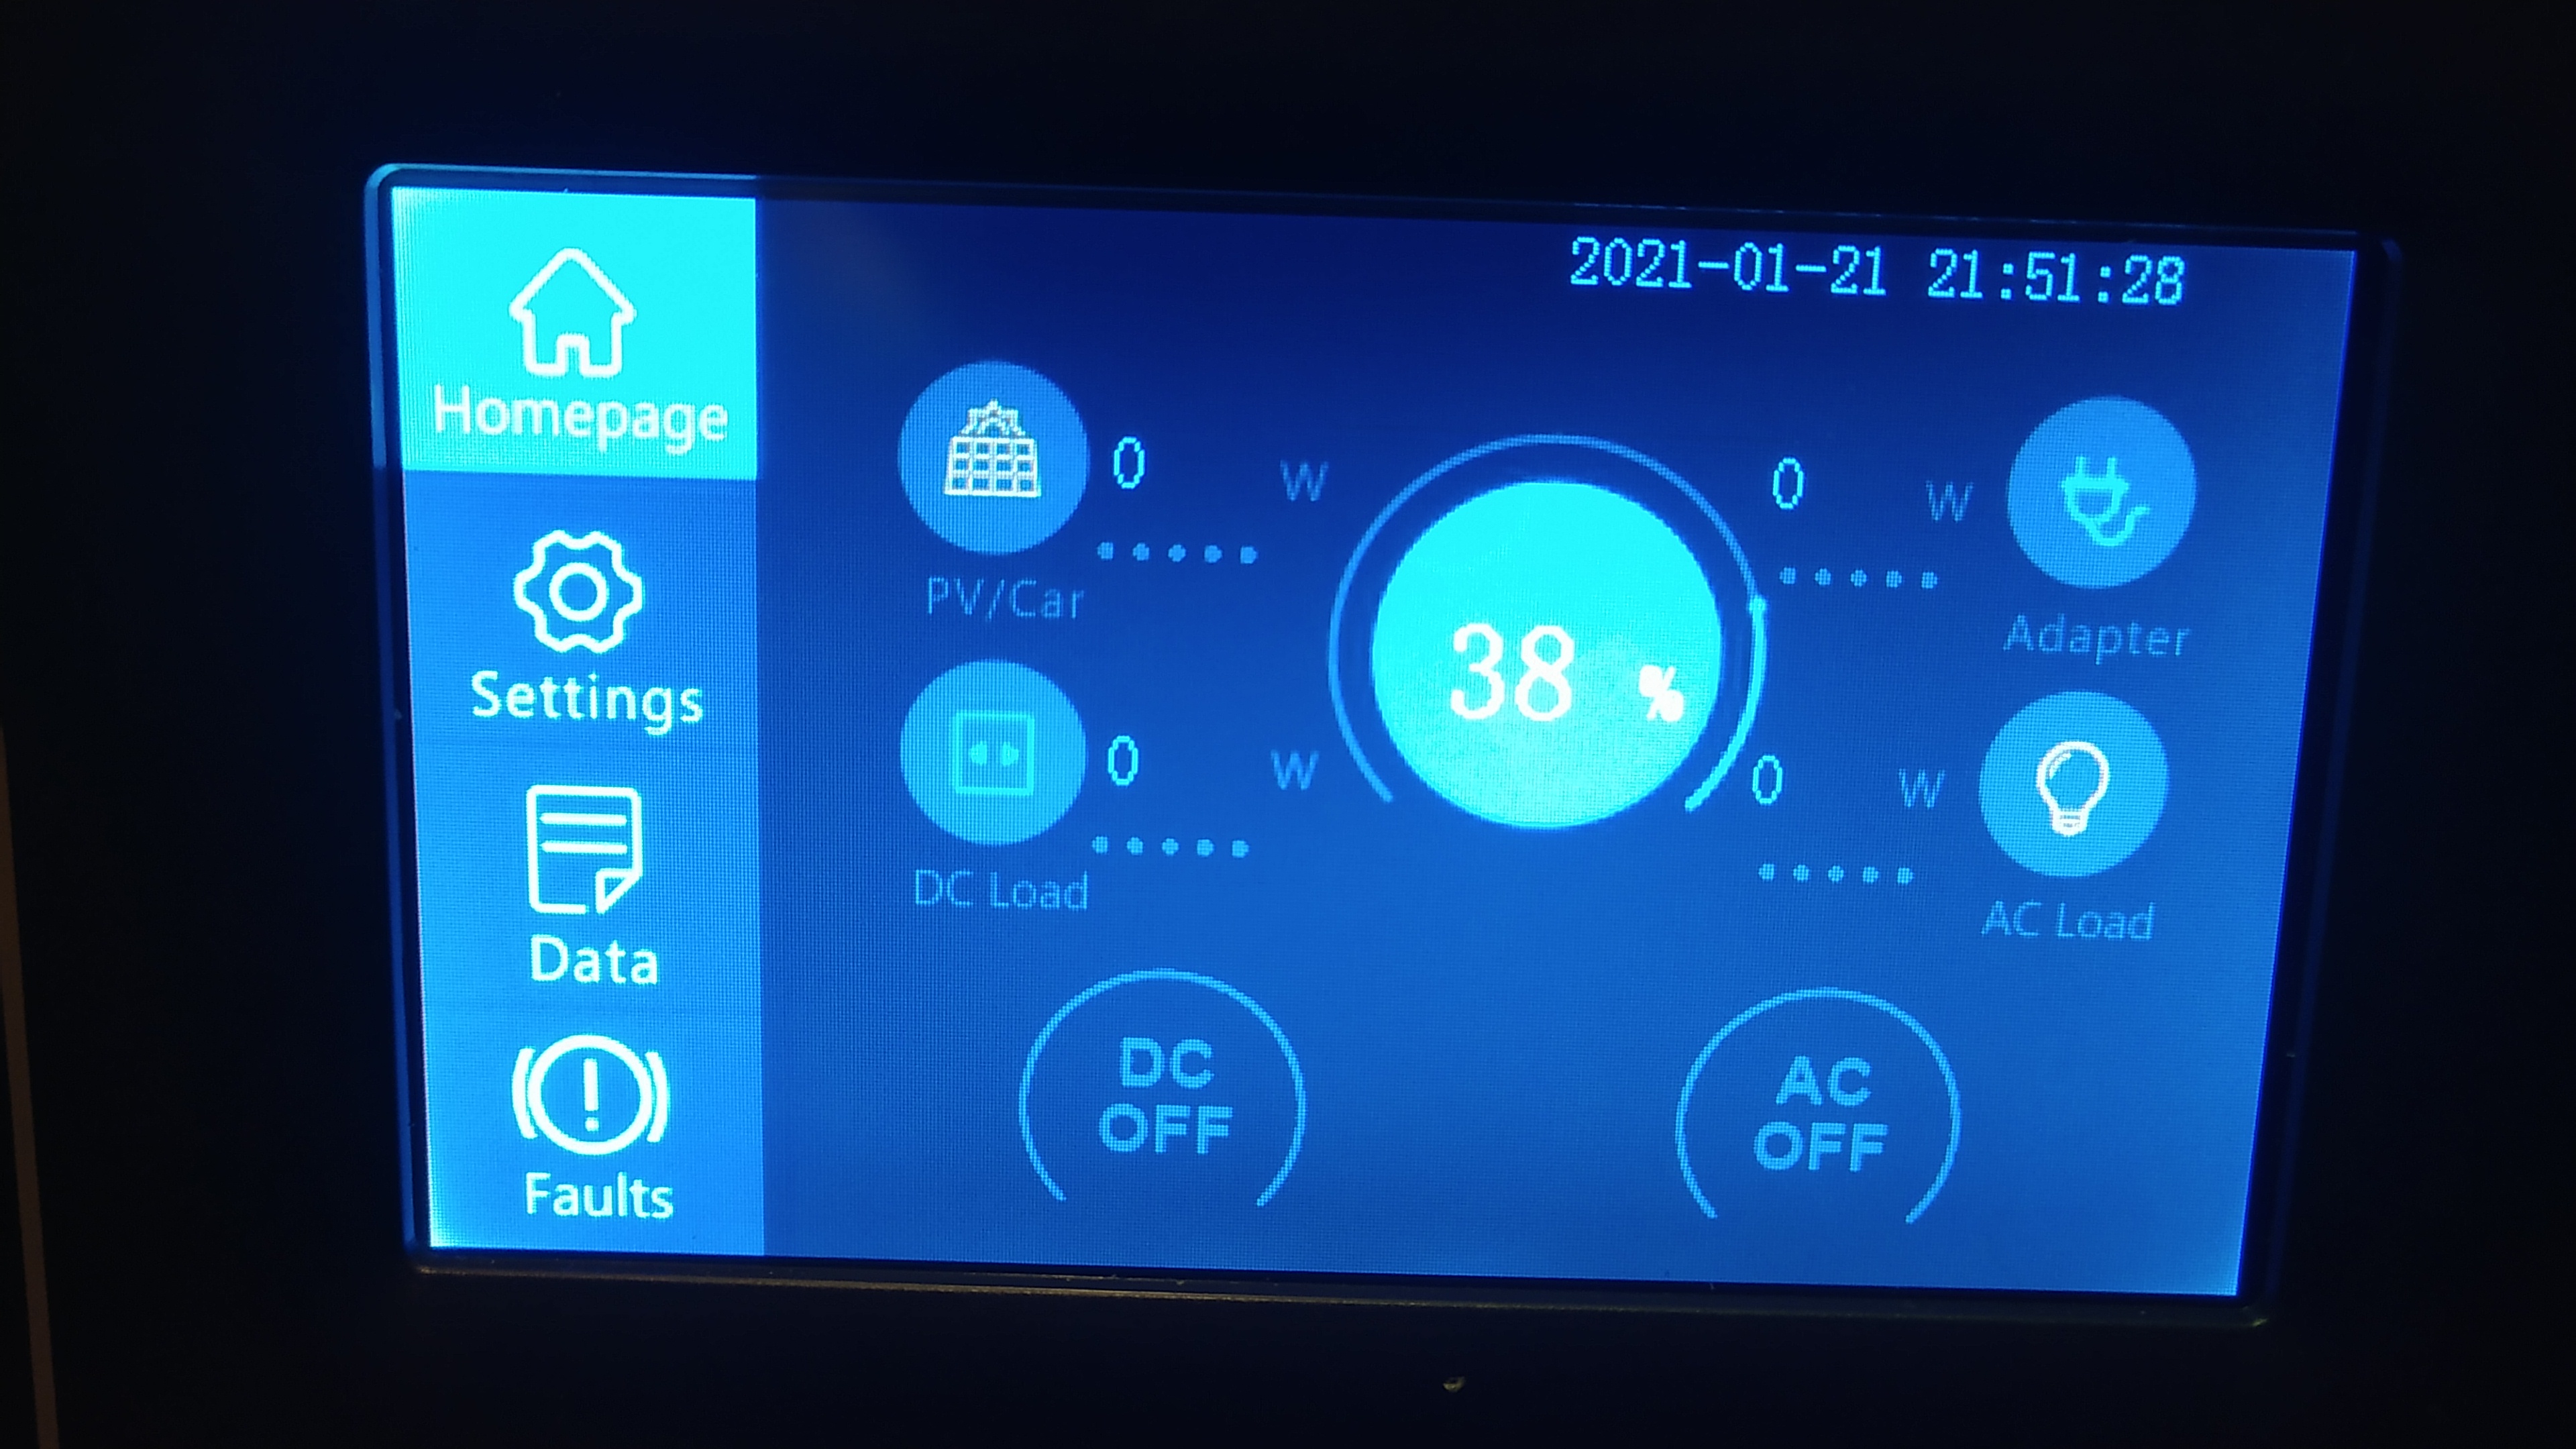
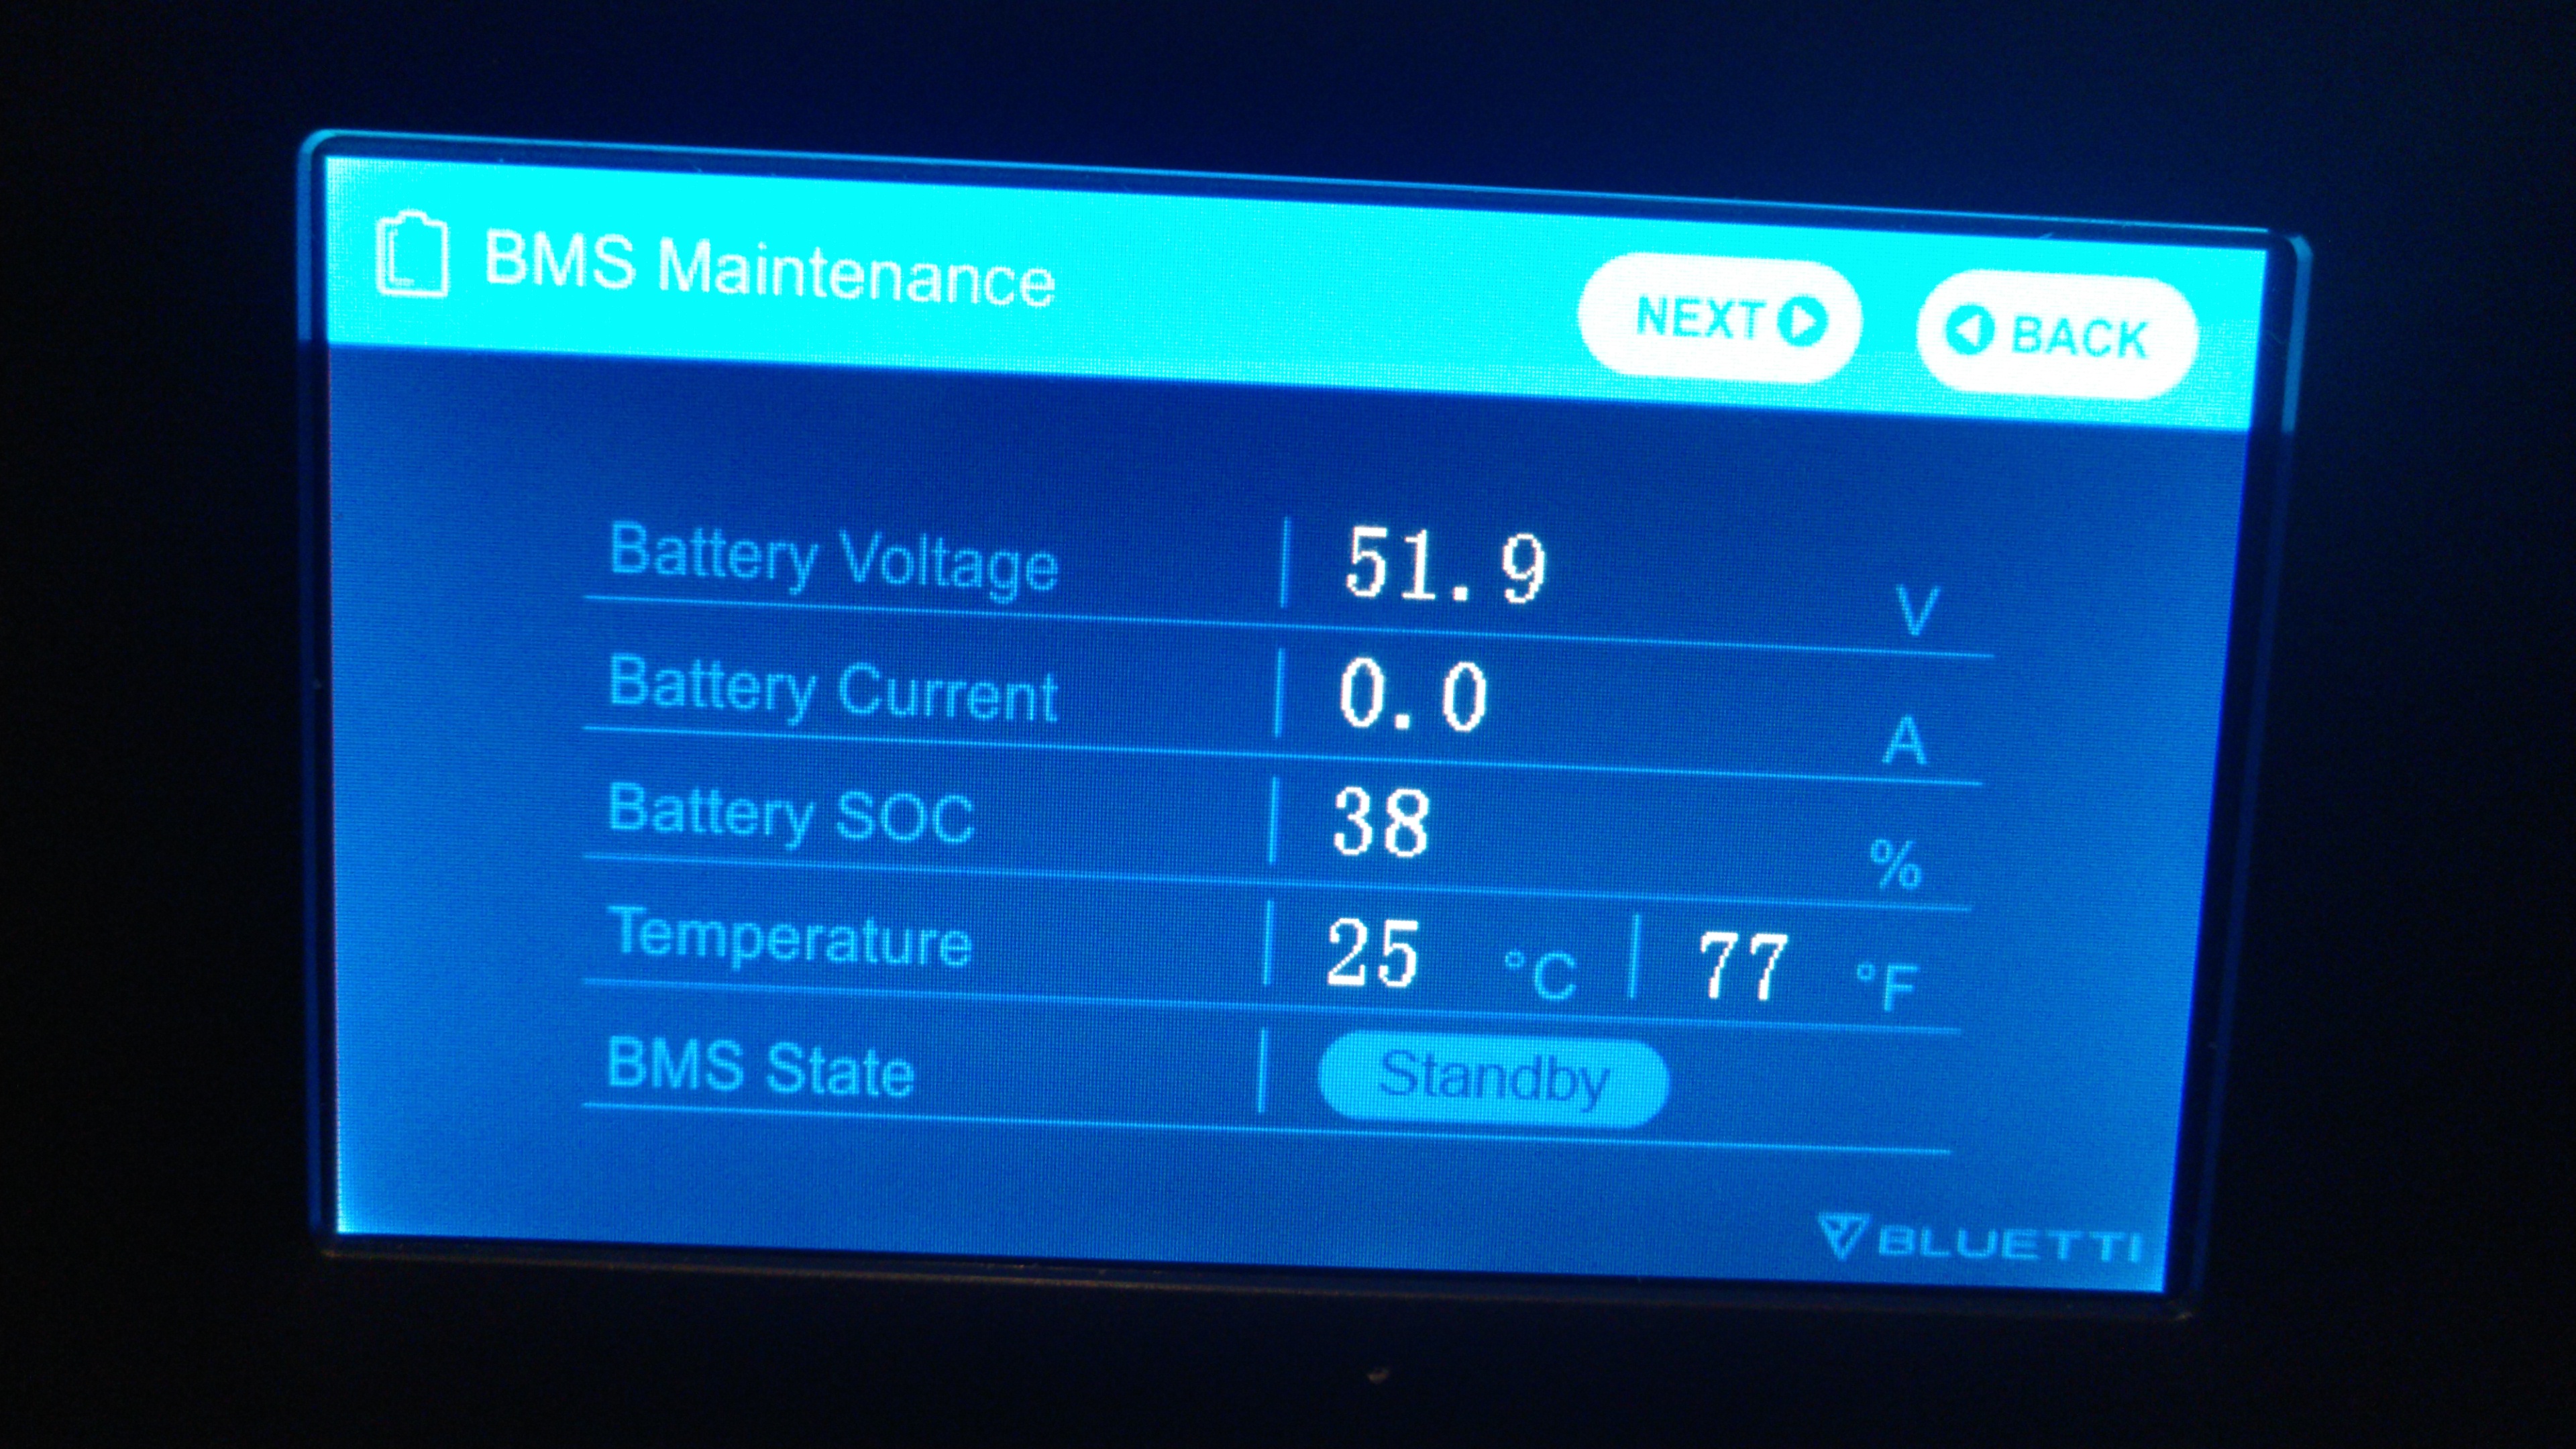
It’s that time of night again. At 120 hours we’re down to 38%…a drop in the last 24 hours of 8% this time.
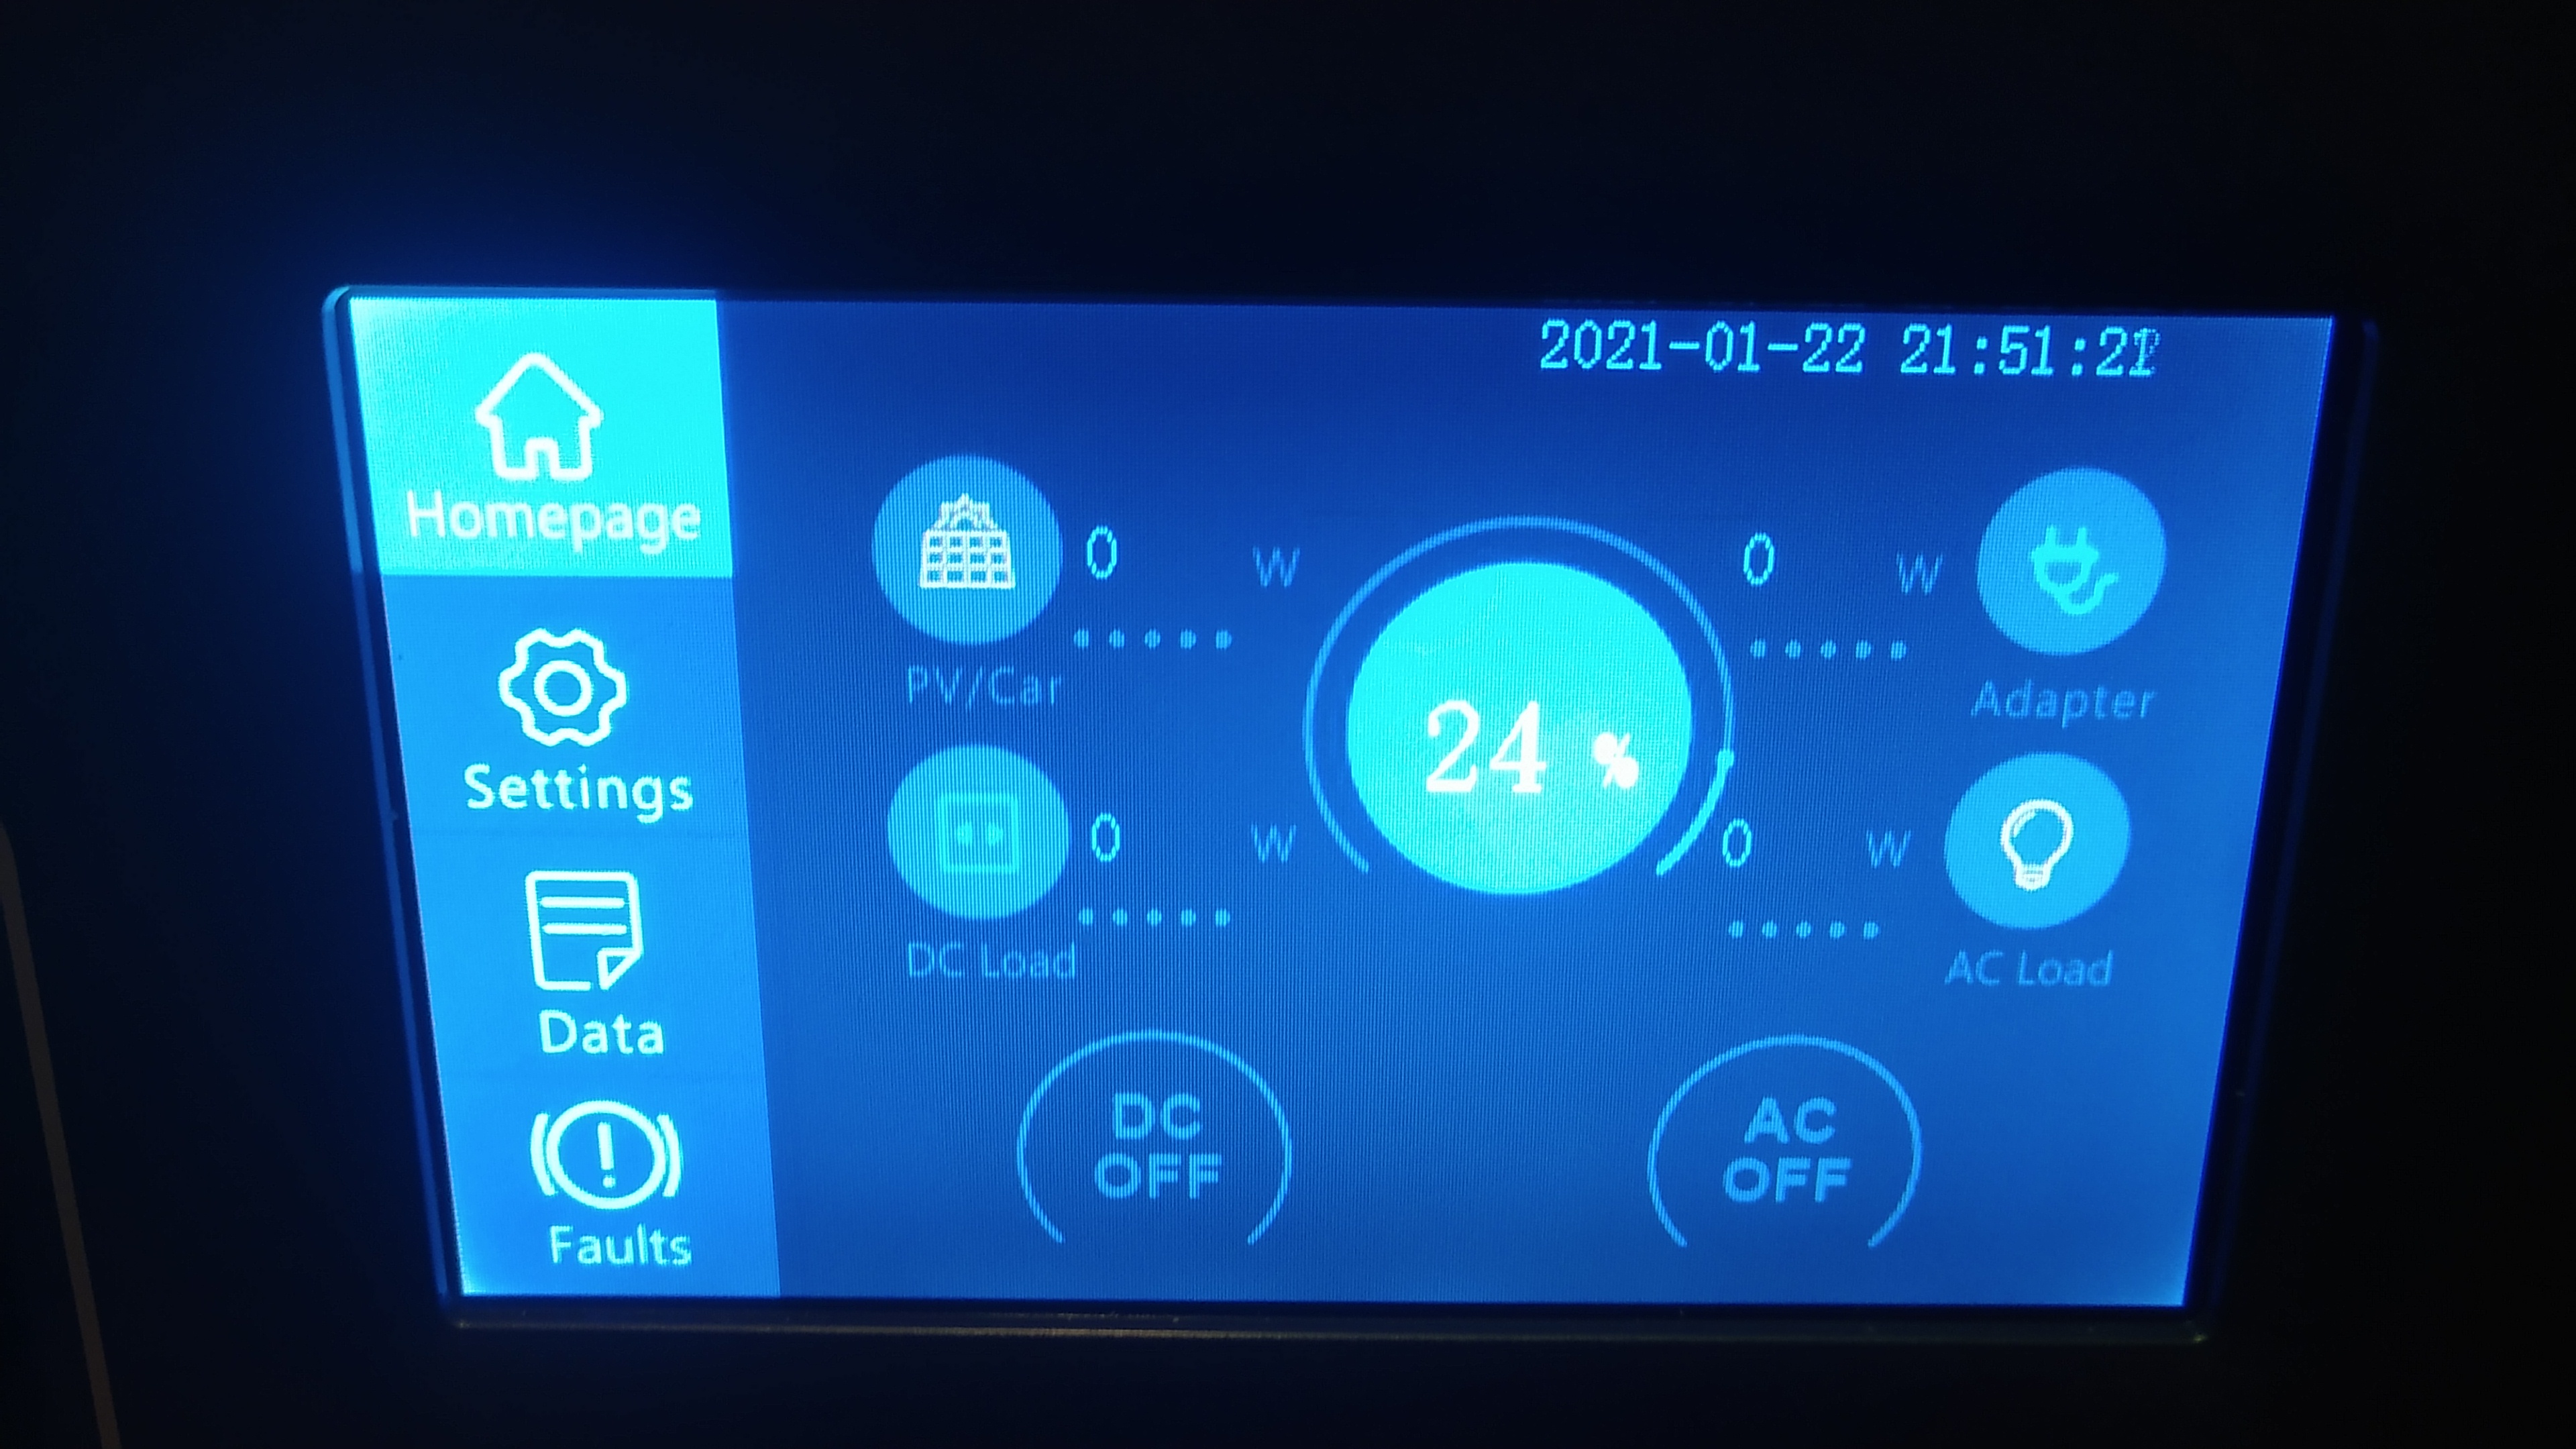
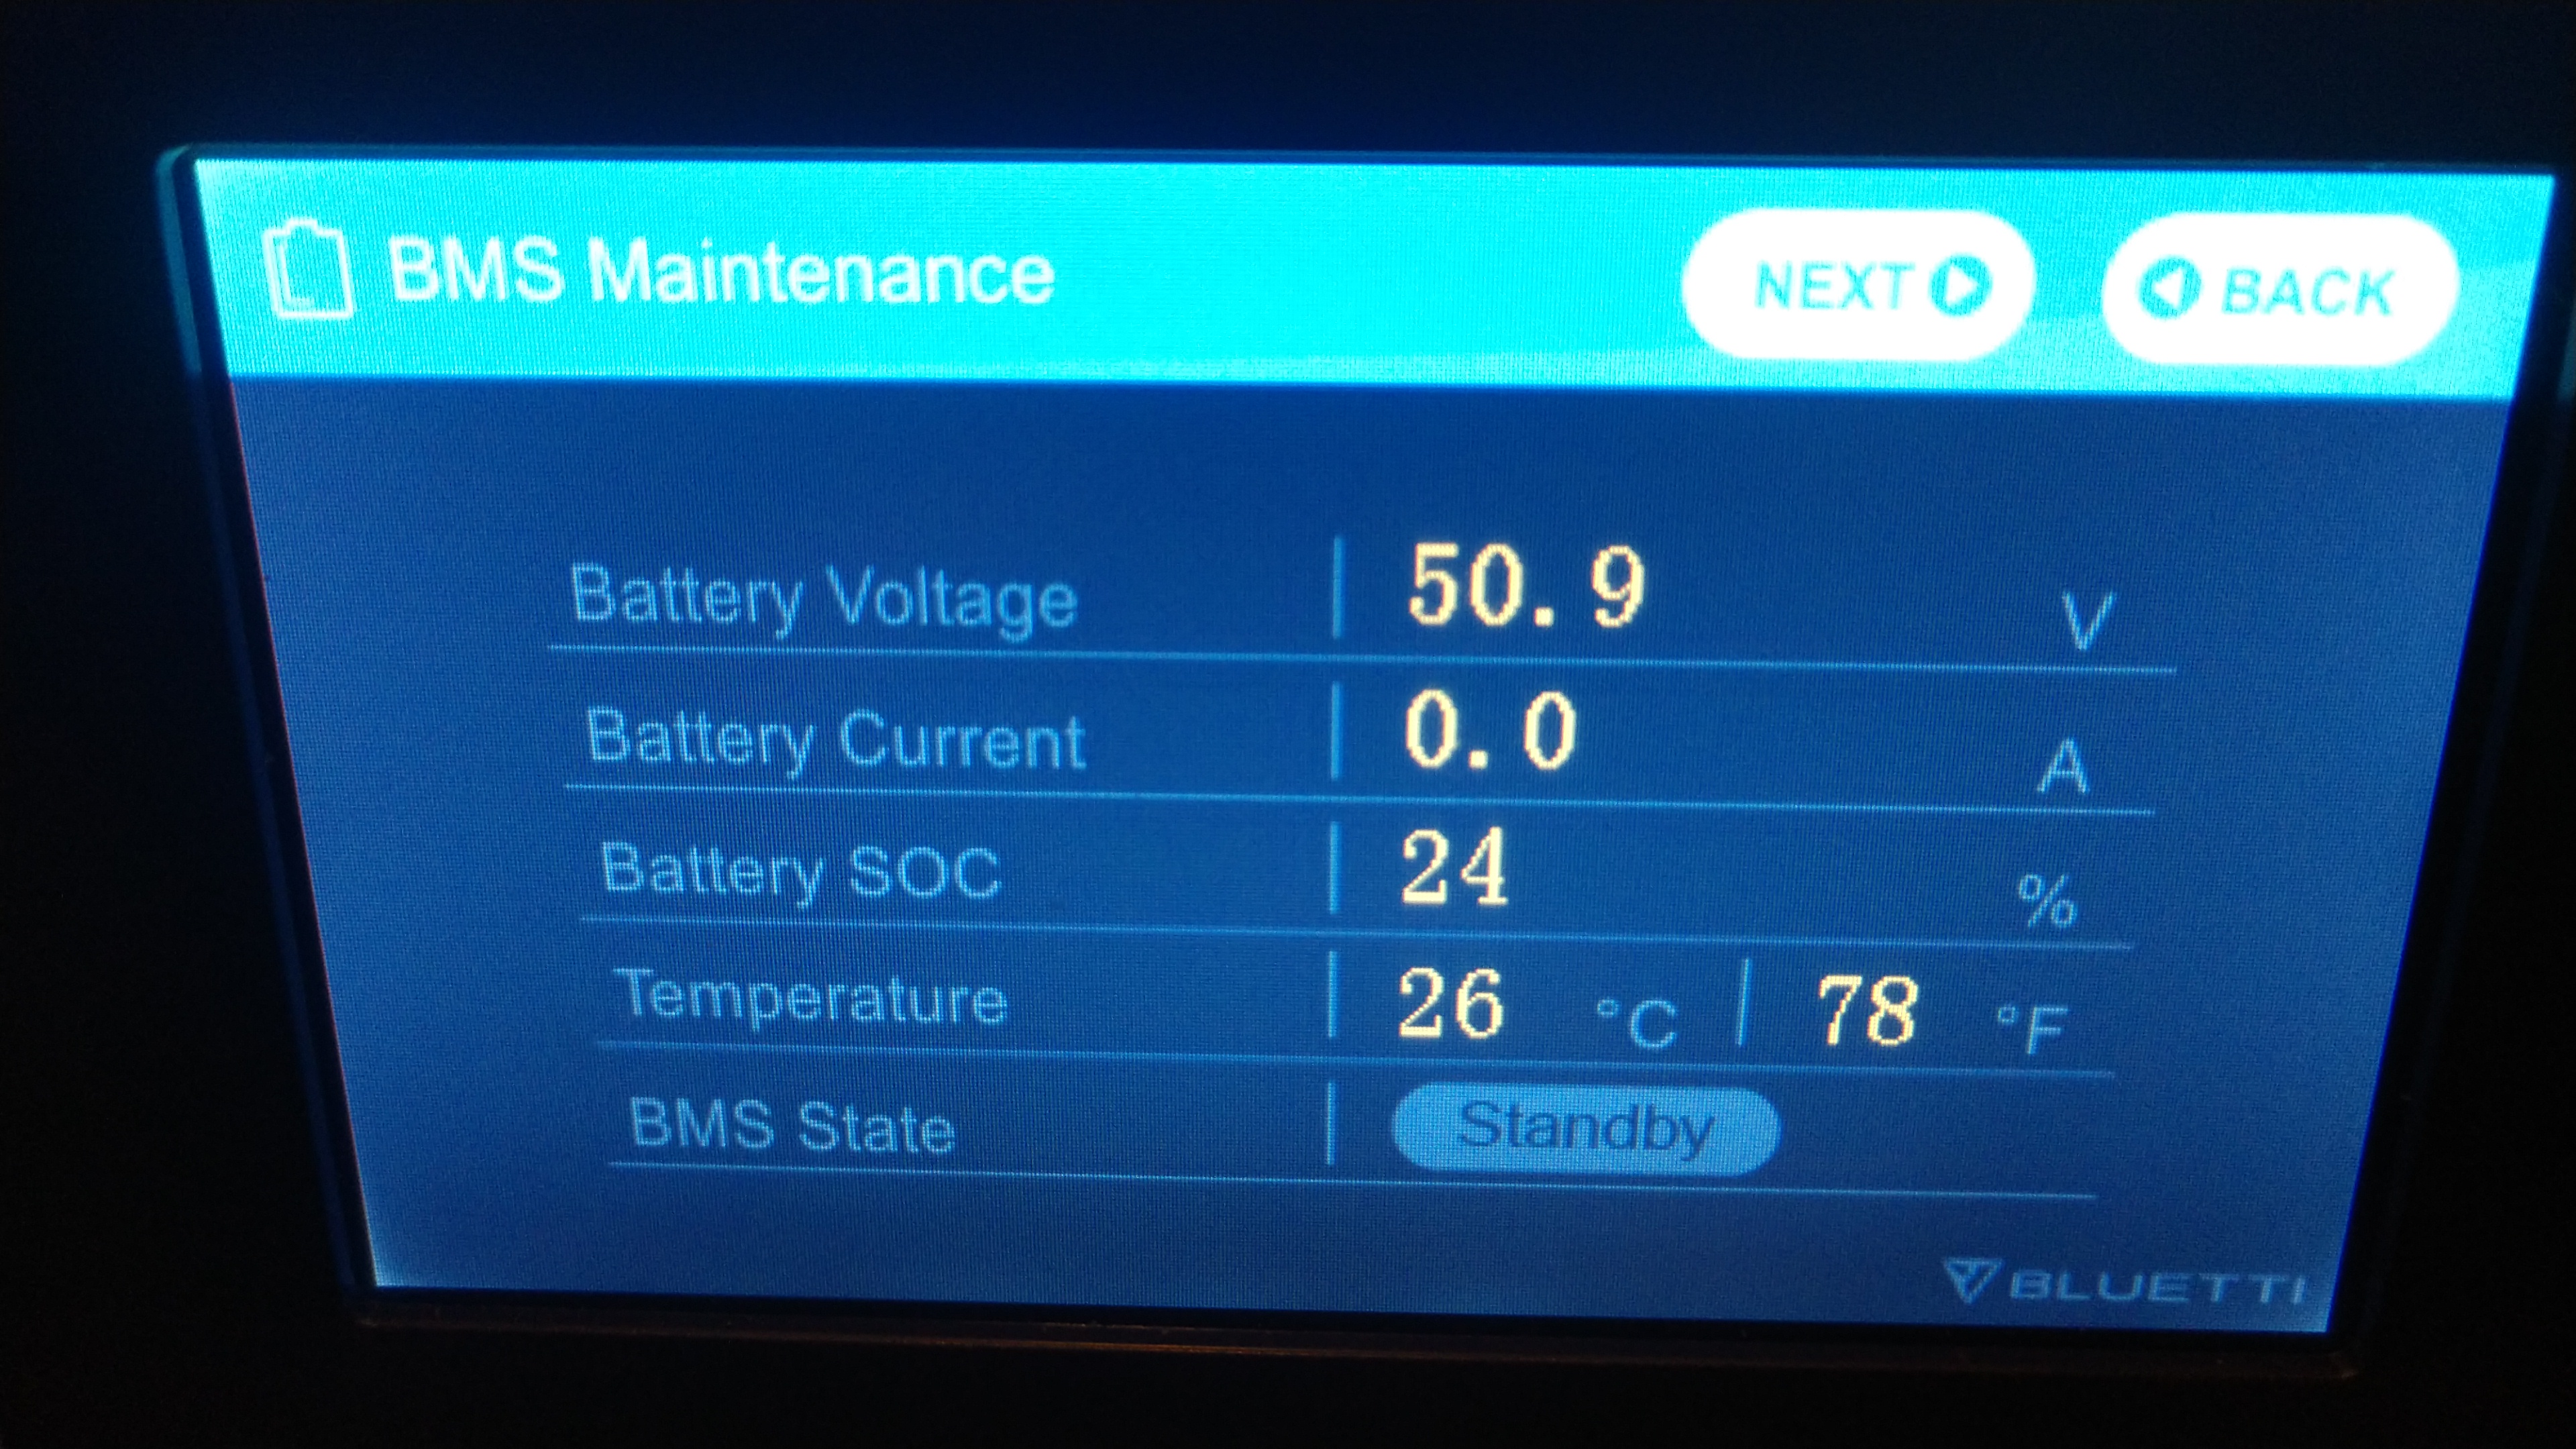
At 144 hours we’re down to 24%…a drop in the last 24 hours of 14% this time. Heading in to the home stretch soon.
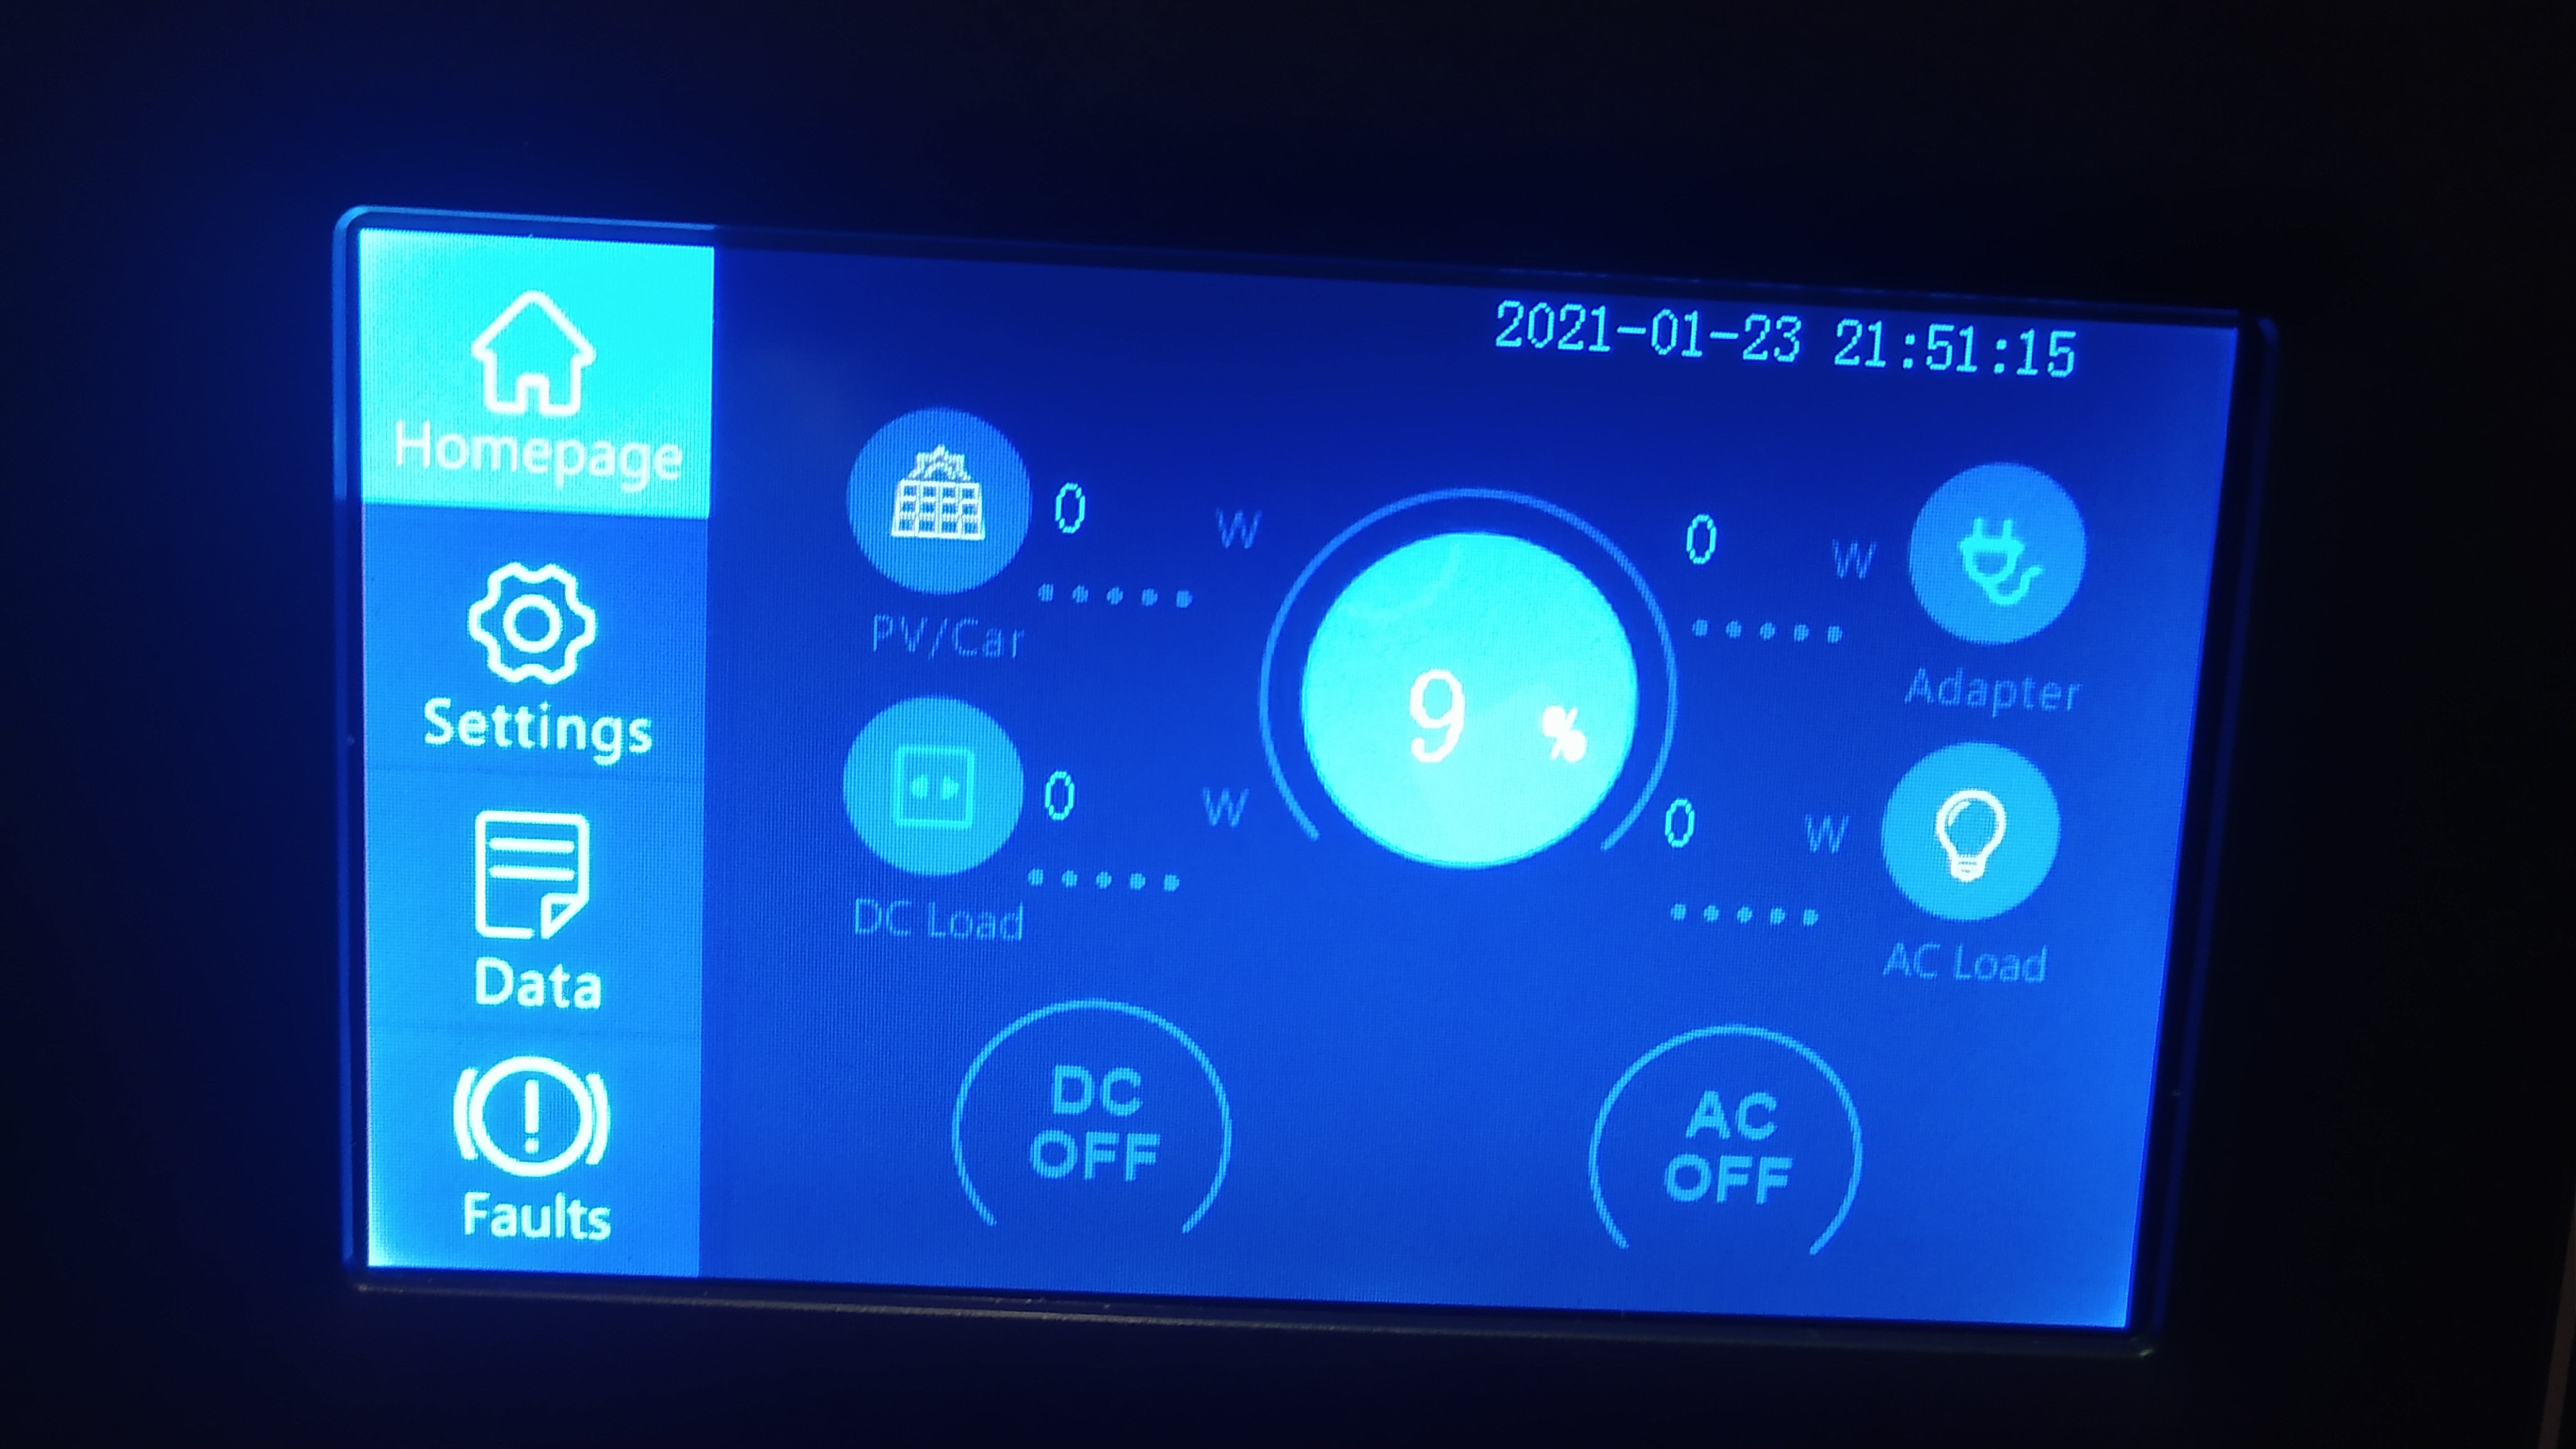
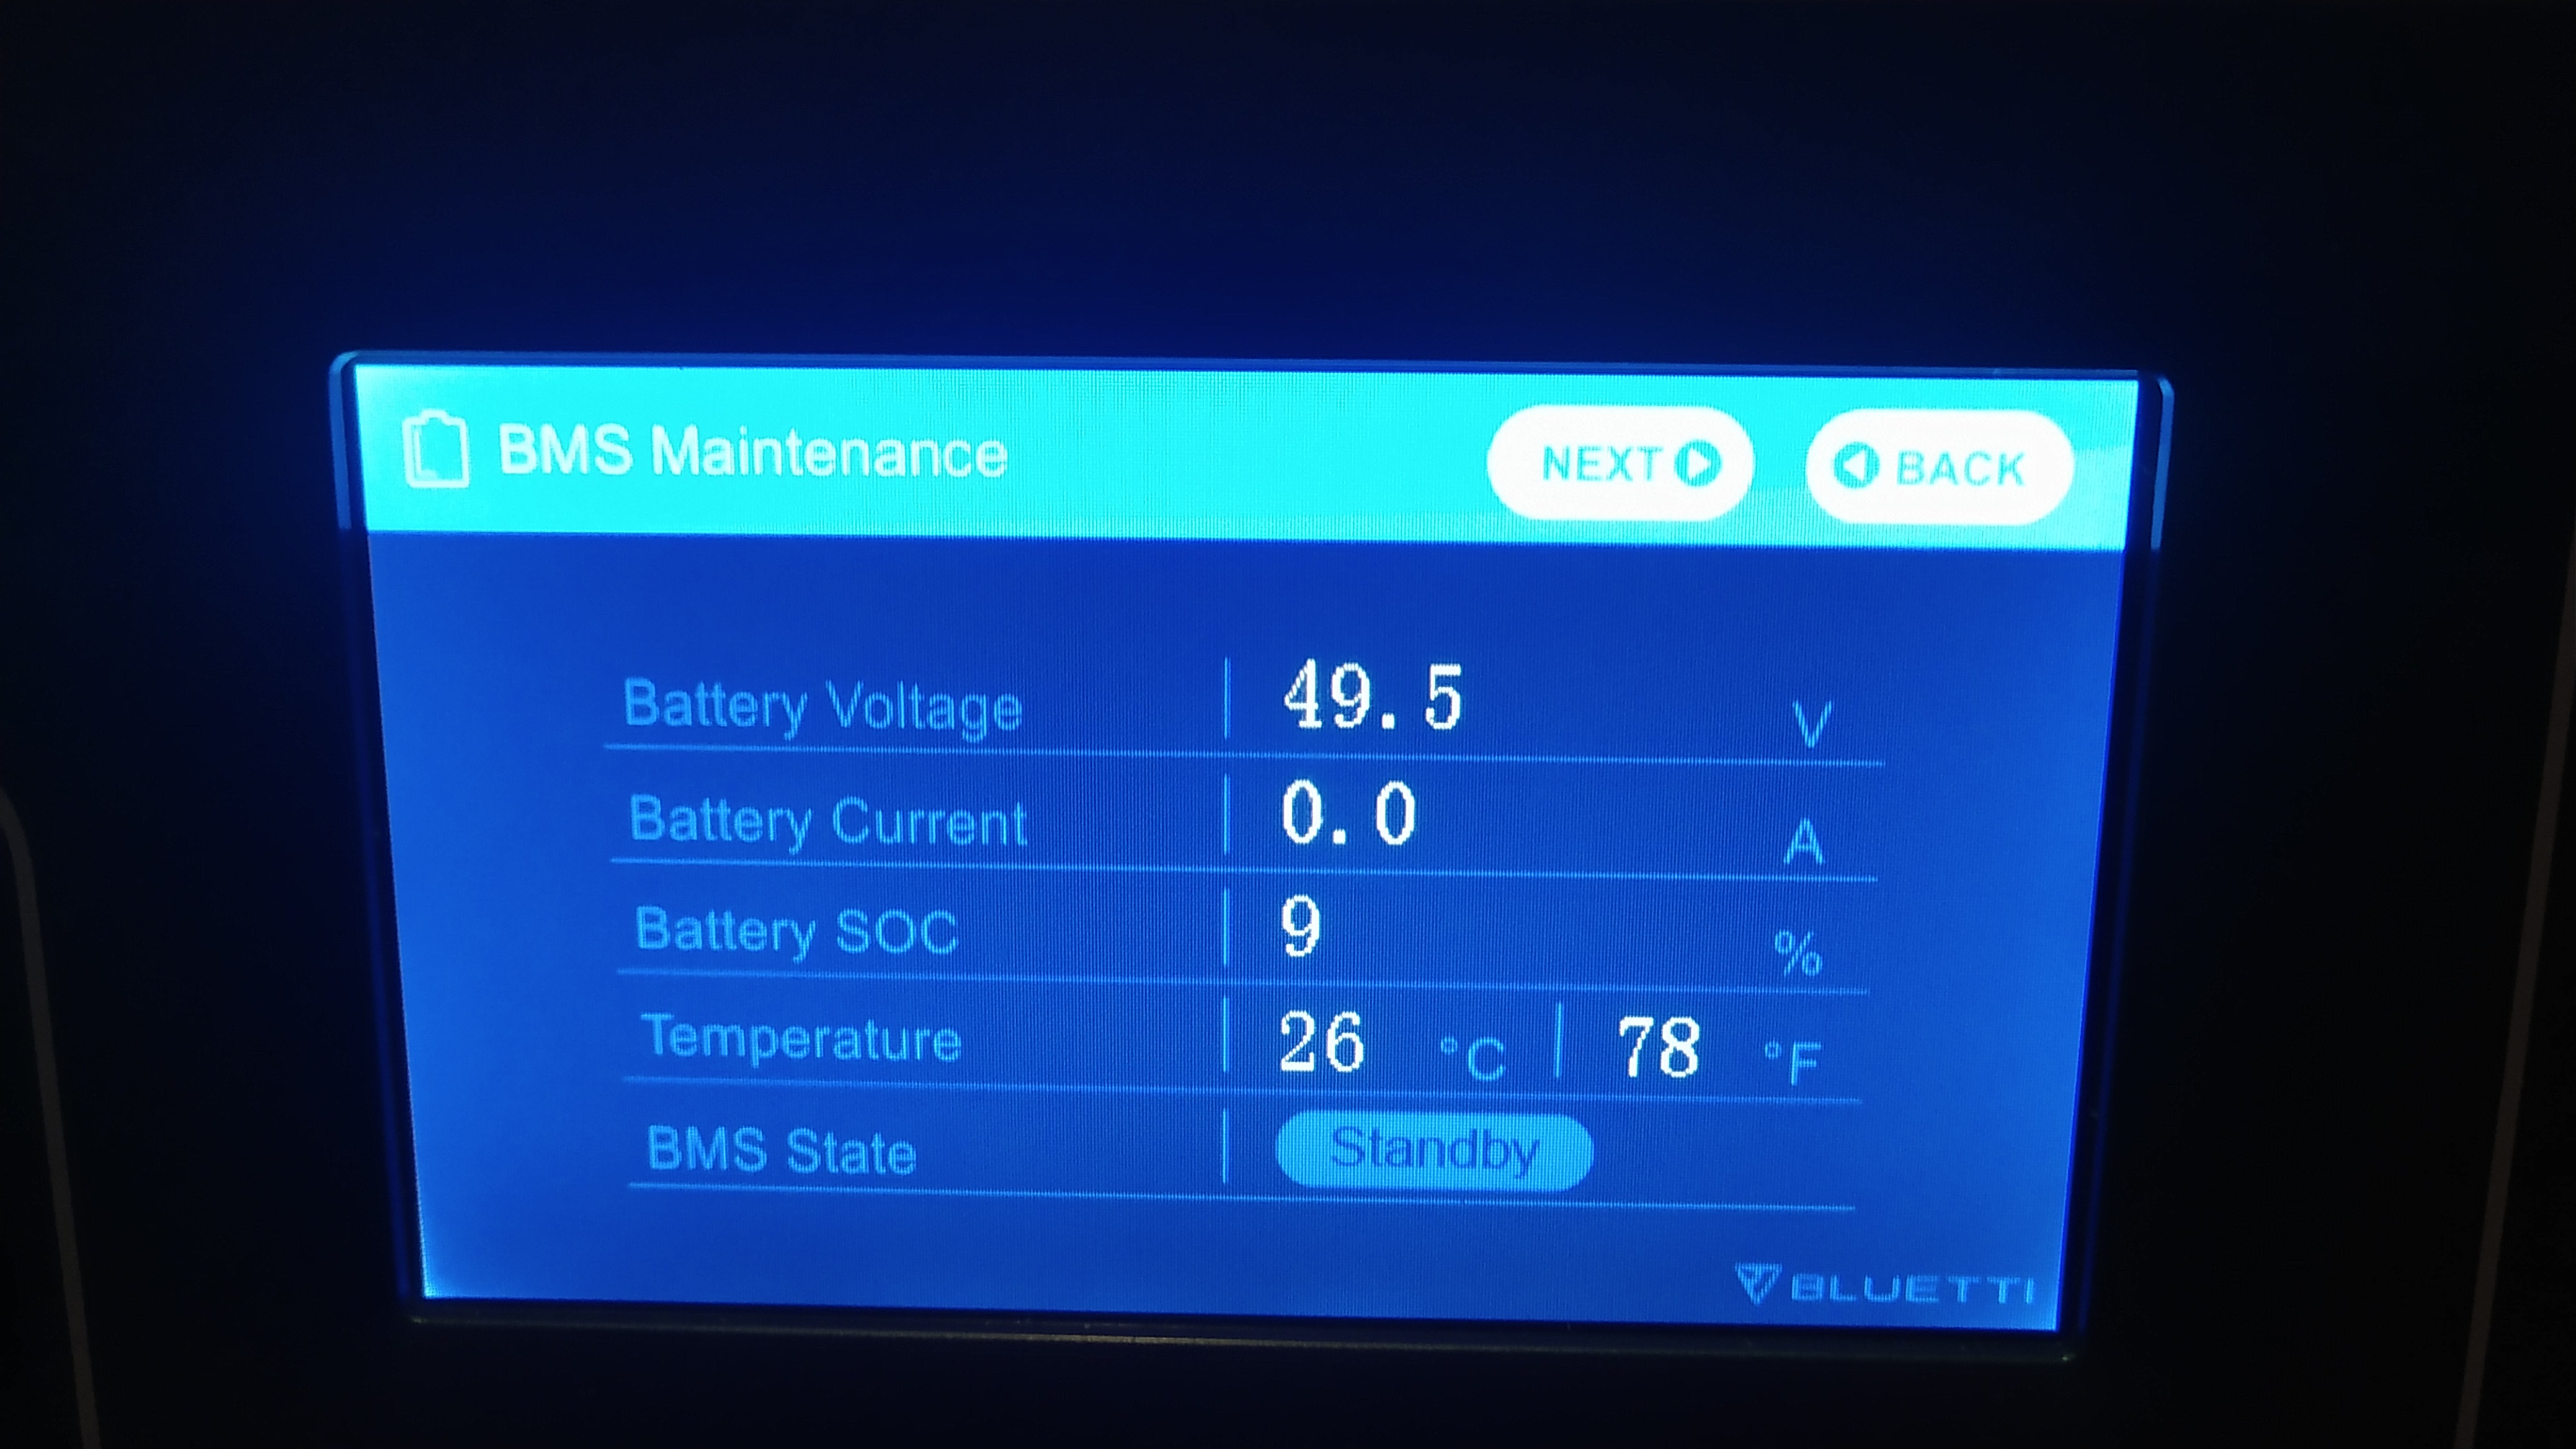
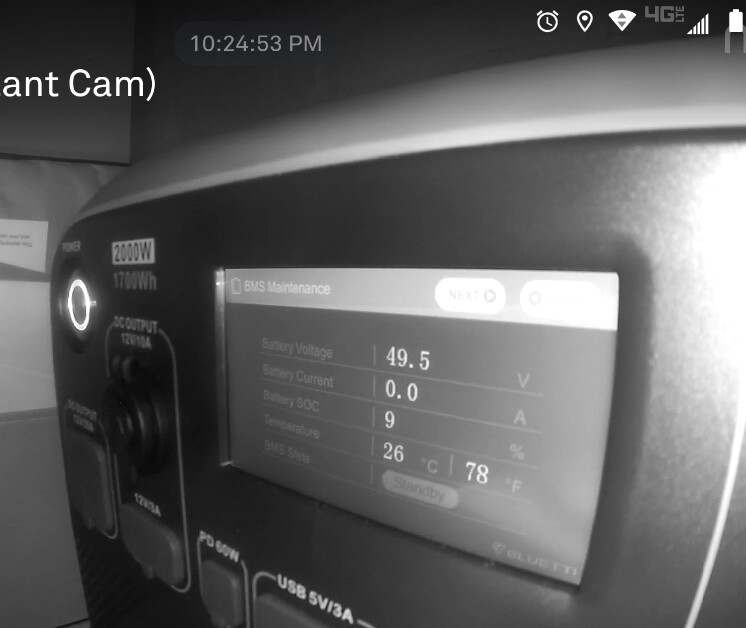
At 168 hours and we’re down to 9%…a drop in the last 24 hours of 15% this time. As the AC200 may drain to 0% in the middle of the night while I’m sleeping, I’ve set up a Nest Cam to record the exact moment she gives up the ghost.
Your dedication is exemplary
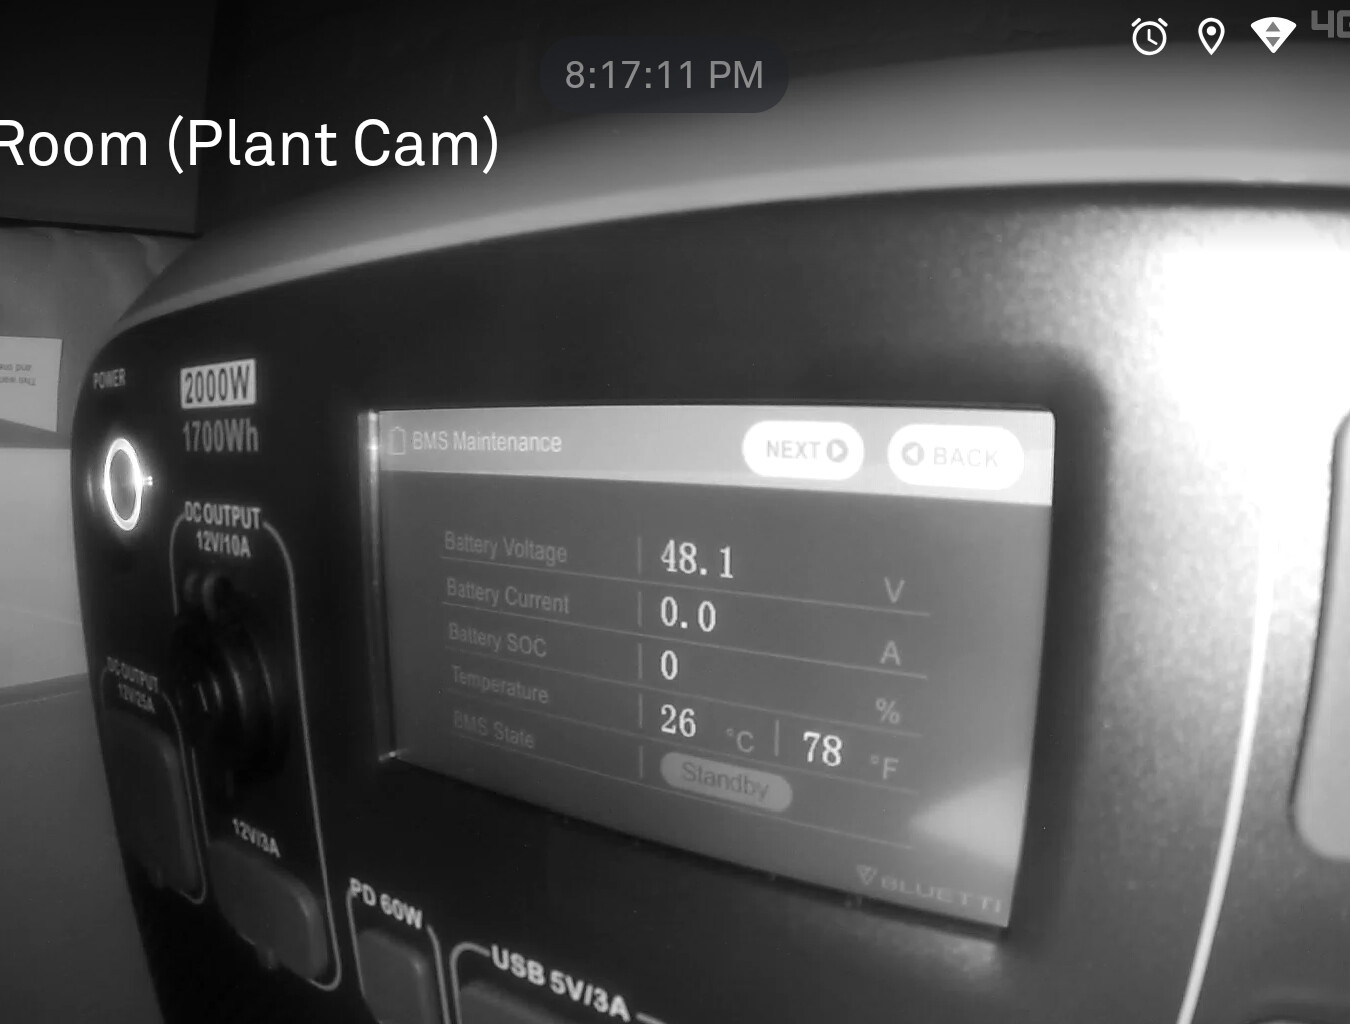
The final results are in! Just an hour and a half (rounding to nearest half-hour) short of 8 full days. With the final day’s test dropping from 9% down to 0%. For a total of 190.5 hours A reminder of the parasitic standby test’s parameters: From 100% SOC, both AC and DC off, ECO mode off, no inputs. As the AC200 automatically shuts down every 24 hours with no activity, I had to religiously and immediately turn it back on in order to keep the test running and accurate. I haven’t done a usable capacity test on the AC200 yet, so can’t do much math with this data point right now for determining or confirming its standby power consumption in this particular scenario. But it was interesting to note how relatively inaccurate the % SOC display is. It must be programmed as an algorithm of voltage and other factors, rather than a measure of true current SOC. This could very well cause some to think their AC200 isn’t functioning properly, when in actuality it might be working just fine. Personally, when I see a meter that is the pancake type (20% 40% 60% 80% 100%), I just assume it’s a very general representation of the SOC. But when I see one with a “%” display that changes point by point, I assume that type is more accurate. In this case it’s clearly not, again probably using some algorithm to “countdown” point by point the approximate SOC. Not a big deal for me, but I can see how some folks might think somethings wrong when they see SOC display behavior that might not make sense. And Scott…it came up a bit short on your original 250 hour estimate. Must be using a bit more juice than you initially thought. Over and out! ![]()
So just short of 8 days for the AC200 but Ben’s experience is discharge in 5 days. A bit discouraging. Hopefully Ben will hear back from @BLUETTI support soon to get explanation.
Not sure why this would be discouraging? Why would a person want to leave the AC200 turned on for an extended period of time without using and expecting the charge to remain 100%?